Page 1 of 1
Muppet Perceptions vs Reality
Posted: Sat Apr 13, 2013 7:38 pm
by MachineGhost
[align=center]

[/align]
Re: Muppet Perceptions vs Reality
Posted: Sat Apr 13, 2013 7:47 pm
by MachineGhost
[align=center]

[/align]
Re: Muppet Perceptions vs Reality
Posted: Mon Apr 15, 2013 7:14 am
by MachineGhost
[align=center]

[/align]
Re: Muppet Perceptions vs Reality
Posted: Mon Apr 22, 2013 4:27 am
by MachineGhost
[align=center]

[/align]
We see that Berkshire loads significantly on the [low beta] and [quality] factors, reflecting that Buffett likes to buy safe, high-quality stocks. Controlling for these factors drives the alpha of Berkshire’s public stock portfolio down to a statistically insignificant annualized 0.1%, meaning that these factors almost completely explain the performance of Buffett’s public portfolio.
Re: Muppet Perceptions vs Reality
Posted: Mon Apr 22, 2013 12:34 pm
by dragoncar
What does Jim Henson have to do with investing?
Re: Muppet Perceptions vs Reality
Posted: Mon Apr 22, 2013 12:43 pm
by melveyr
dragoncar wrote:
What does Jim Henson have to do with investing?
Internally, some people at Goldman Sach's have called their less sophisticated clients "muppets."
Re: Muppet Perceptions vs Reality
Posted: Mon Apr 22, 2013 2:53 pm
by rocketdog
MachineGhost wrote:
[align=center]
[/align]
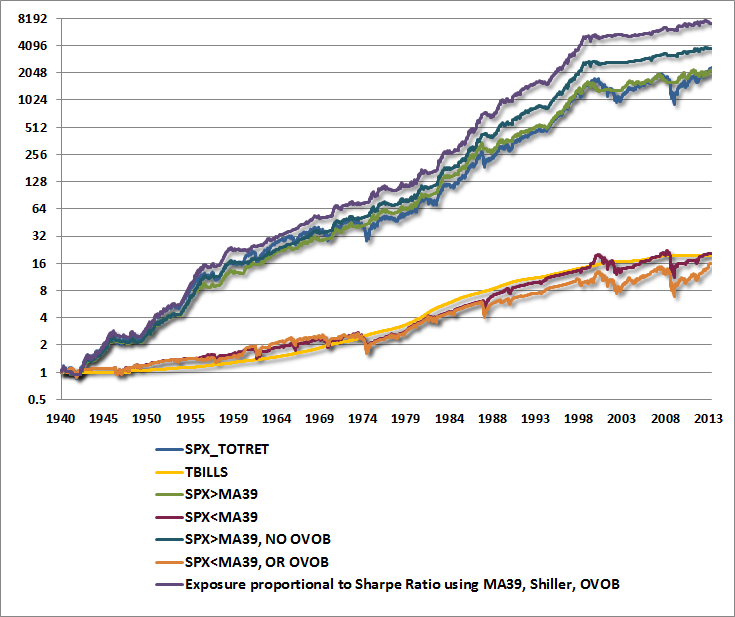
I find this interesting. After the huge drawdown during the Great Depression, all portfolios basically move in lock-step. I would have expected that excluding the worst months would have resulted in a steeper trajectory upwards and vice versa for excluding the best months. They should have diverged over time, so the chart doesn't make sense to me.
Re: Muppet Perceptions vs Reality
Posted: Mon Apr 22, 2013 9:21 pm
by MachineGhost
rocketdog wrote:
I find this interesting. After the huge drawdown during the Great Depression, all portfolios basically move in lock-step. I would have expected that excluding the worst months would have resulted in a steeper trajectory upwards and vice versa for excluding the best months. They should have diverged over time, so the chart doesn't make sense to me.
They did diverge over time, except all started diverging right at the 1929 peak where the return series starts rather than the trough which is a bit misleading. Also, the chart looks logarithmic so it probably understates the trajectories experienced at any point-in-time.
Re: Muppet Perceptions vs Reality
Posted: Mon Apr 22, 2013 10:56 pm
by dragoncar
melveyr wrote:
dragoncar wrote:
What does Jim Henson have to do with investing?
Internally, some people at Goldman Sach's have called their less sophisticated clients "muppets."
Wow I must have missed that memo :-)
Re: post great depression diversion, isn't that mostly due to the timing of the best and worst 10 months mostly occurring near that timeframe? If you used the 10th-20th best and worst months maybe it would diverge more later on
Re: Muppet Perceptions vs Reality
Posted: Mon Apr 22, 2013 11:00 pm
by Tyler
melveyr wrote:
dragoncar wrote:
What does Jim Henson have to do with investing?
Internally, some people at Goldman Sach's have called their less sophisticated clients "muppets."
Ah! I've actually been wondering about all the muppet references around here lately. Now it finally makes sense.
Re: Muppet Perceptions vs Reality
Posted: Tue Apr 23, 2013 8:02 am
by MachineGhost
MangoMan wrote:
Muppet: A person who is ignorant and generally has no idea about anything.
I think it was used even earlier by Wall Street, i.e. the 1960's, back when the term was "moppet".
The point of the divergent returns chart was to show that both good and bad months are
clustered together. The good months follow
right after the bad months due to mean-reversion as emotional sanity retakes hold, so you are better off being in the market and achieving that upside than missing out on the best ten months. Likewise, you are better off avoiding the ten worst month than being in the market. In other words, the upside will take care of itself as long as you control your losses which is not what the muppets do, they ride their losses all the way down and avoid the market all the way up (like now).
Re: Muppet Perceptions vs Reality
Posted: Tue Apr 23, 2013 12:00 pm
by craigr
Muppet is also New Zealand (and Australia?) slang for someone that is ignorant.
Re: Muppet Perceptions vs Reality
Posted: Tue Apr 23, 2013 1:43 pm
by rocketdog
MachineGhost wrote:
rocketdog wrote:
I find this interesting. After the huge drawdown during the Great Depression, all portfolios basically move in lock-step. I would have expected that excluding the worst months would have resulted in a steeper trajectory upwards and vice versa for excluding the best months. They should have diverged over time, so the chart doesn't make sense to me.
They did diverge over time, except all started diverging right at the 1929 peak where the return series starts rather than the trough which is a bit misleading. Also, the chart looks logarithmic so it probably understates the trajectories experienced at any point-in-time.
Ah, it's the logarithmic scale that threw me off.

Re: Muppet Perceptions vs Reality
Posted: Fri Apr 26, 2013 3:51 am
by MachineGhost
[align=center]

[/align]
From 16 countries, excludes Germany.
Re: Muppet Perceptions vs Reality
Posted: Fri Apr 26, 2013 5:34 pm
by Bean
Will these blanket deragortary threads or posts about muppets help people coming to these forums feel welcome and increase returns?
I really enjoy your threads MG, but this is starting to get old.
Re: Muppet Perceptions vs Reality
Posted: Fri Apr 26, 2013 8:46 pm
by MachineGhost
All righty, I'll put a kibosh on it.
Re: Muppet Perceptions vs Reality
Posted: Fri Apr 26, 2013 8:56 pm
by Bean
MachineGhost wrote:
All righty, I'll put a kibosh on it.
I think the karma gods struck me back for being grumpy. Upstairs bathroom decided to spring a leak.

Re: Muppet Perceptions vs Reality
Posted: Sat Apr 27, 2013 12:13 am
by Liz L.
Me, I want all the Machine Ghost posts I can get.
Also don't think newcomers are that fragile.
Re: Muppet Perceptions vs Reality
Posted: Sun Apr 28, 2013 12:37 am
by Benko
Liz L. wrote:
Also don't think newcomers are that fragile.
Agree. And they probably won't know what muppets means either.
Re: Muppet Perceptions vs Reality
Posted: Sun Apr 28, 2013 4:03 am
by MachineGhost
[align=center]

[/align]
Re: Muppet Perceptions vs Reality
Posted: Thu May 02, 2013 1:44 am
by MachineGhost
[align=center]

[/align]
Re: Muppet Perceptions vs Reality
Posted: Sun May 05, 2013 11:03 am
by MachineGhost
[align=center]

[/align]
Re: Muppet Perceptions vs Reality
Posted: Sun May 05, 2013 11:13 am
by Pointedstick
Well okay, those are the top federal tax rates you could pay. For most of us, things aren't changing right now.
Re: Muppet Perceptions vs Reality
Posted: Mon May 06, 2013 10:30 am
by Pointedstick
TennPaGa wrote:
2012 2013 % increase
---- ---- ----------
OASDI Tax 4.2% 6.2% 48%
Well that's true, and it sucks. But I thought we were talking about capital gains tax rates, not the taxes levied on wages.
Re: Muppet Perceptions vs Reality
Posted: Mon May 06, 2013 10:39 am
by MachineGhost
[align=center]
[/align]