That may technically be true but I think a lot of the dips with the PP over the years were hidden by inflation. What I mean is that it felt OK to be up 4% when inflation was at 8%. The equivalent now would be a PP that was down 4% (more or less) for the year. A three-year period of doldrums is not at all unheard of. 2000 through 2002 comes to mind.MachineGhost wrote: And it is historically unprecedented for the PP to have a losing year, a winning year and a losing year in a row. That is out of sample behavior so that is a warning that old operating assumptions may fall apart.
Portfolio Charts
Moderator: Global Moderator
Re: Portfolio Charts

Re: Portfolio Charts
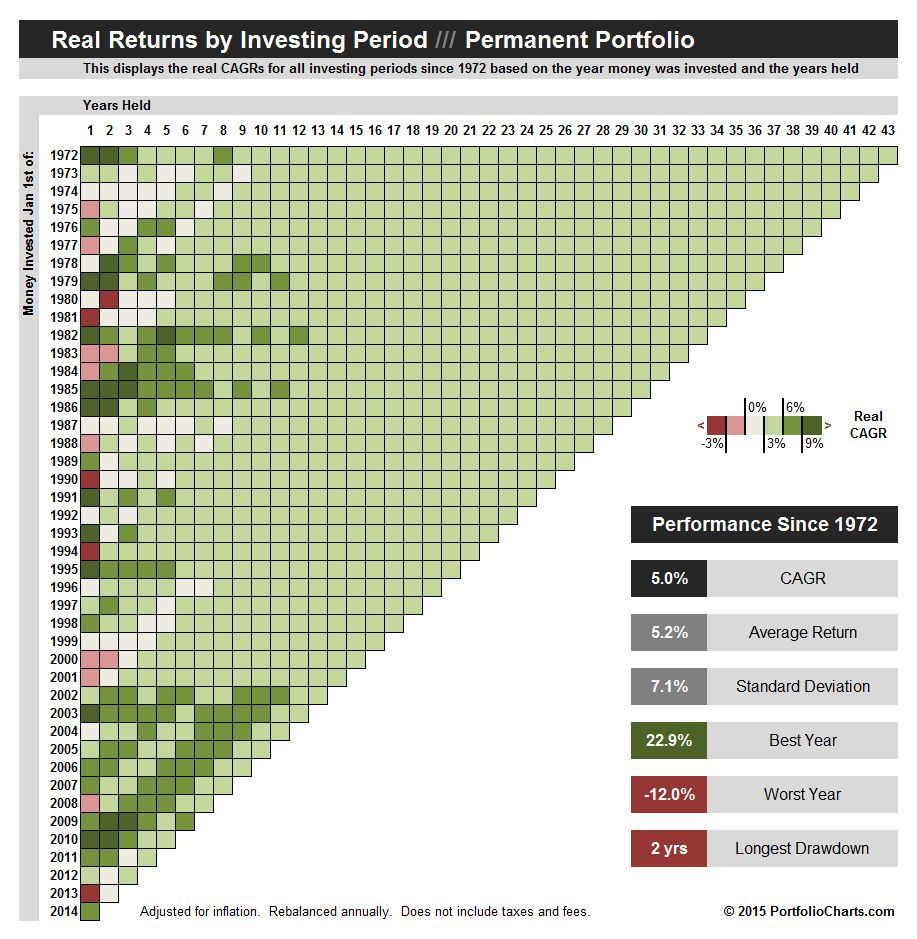
That's true in nominal terms, but Barrett is correct that once you account for inflation the idea that the PP "never goes down" is a misnomer. Look at the leftmost column of this chart:MachineGhost wrote: And it is historically unprecendented for the PP to have a losing year, a winning year and a losing year in a row.
[img width=300]https://portfoliocharts.files.wordpress ... xel-21.jpg[/img]
Looking at the real (inflation-adjusted) numbers, the PP has seen 12 down years since 1972. The exact same number as a 60-40 portfolio and right in-line with most investing strategies. The difference is that the down years are much less severe (half of the PP down years were down less than 1% and the worst was 12%, while 8 of 12 for 60/40 were down more than 5% and the worst was 23%) if not necessarily less common.
IMHO, the recent run of two out of three mild down years is really nothing unusual from a historical perspective. There's no such thing as a portfolio that always goes up, but comparatively speaking the PP remains about as close as you'll find.


Re: Portfolio Charts
True. But of course the tax man also sees those nominal gains!Desert wrote:Yeah, I agree. Also, I think we don't really experience small or negative real returns emotionally, when the nominal return is positive.barrett wrote:That may technically be true but I think a lot of the dips with the PP over the years were hidden by inflation. What I mean is that it felt OK to be up 4% when inflation was at 8%. The equivalent now would be a PP that was down 4% (more or less) for the year. A three-year period of doldrums is not at all unheard of. 2000 through 2002 comes to mind.MachineGhost wrote: And it is historically unprecedented for the PP to have a losing year, a winning year and a losing year in a row. That is out of sample behavior so that is a warning that old operating assumptions may fall apart.
-
lordmetroid

- Executive Member

- Posts: 200
- Joined: Wed Nov 26, 2014 3:53 pm
Re: Portfolio Charts
I know bitcoins does not have much of a history but could you perhaps add Bitcoins as an asset class?
Re: Portfolio Charts
Add as an asset class to what?
There's discussions about Bitcoins in the VP section. It may ascend to "default global currency" status one day, but at this moment it's an incredibly volatile and risky investment, not to mention that your bitcoin vault can still be hacked. I would have LOVED to buy a few when the price was $25, though!
There's discussions about Bitcoins in the VP section. It may ascend to "default global currency" status one day, but at this moment it's an incredibly volatile and risky investment, not to mention that your bitcoin vault can still be hacked. I would have LOVED to buy a few when the price was $25, though!
-
lordmetroid
- Executive Member
- Posts: 200
- Joined: Wed Nov 26, 2014 3:53 pm
Re: Portfolio Charts
Add Bitcoin as an asset class to the calculators at portfoliocharts.comWiseOne wrote: Add as an asset class to what?
...
You do not need to get bitcoins yourself. You can invest in bitcoins via ETF:s and Certificates nowdays.
Re: Portfolio Charts
Bitcoins are not recommended for a PP. To me, this seems like a fad that will end very badly for anyone left holding the bag. Use caution!
Re: Portfolio Charts
Unfortunately bitcoins do not have enough history for the calculators to be particularly useful.lordmetroid wrote: I know bitcoins does not have much of a history but could you perhaps add Bitcoins as an asset class?
-
Libertarian666
- Executive Member
- Posts: 5994
- Joined: Wed Dec 31, 1969 6:00 pm
Re: Portfolio Charts
Can we add Beanie Babies too?WiseOne wrote: Add as an asset class to what?
There's discussions about Bitcoins in the VP section. It may ascend to "default global currency" status one day, but at this moment it's an incredibly volatile and risky investment, not to mention that your bitcoin vault can still be hacked. I would have LOVED to buy a few when the price was $25, though!
Oh, that fad is over already. Now they tell me!
Re: Portfolio Charts
Tyler, can you please provide me with a chart showing me what will happen say for the next 12 months?
Thanks and Best Wishes!
Thanks and Best Wishes!
-
Mark Leavy

- Executive Member
- Posts: 1950
- Joined: Thu Mar 01, 2012 10:20 pm
- Location: US Citizen, Permanent Traveler
Re: Portfolio Charts
Reub, I never suspected that frugal was your doppelg�nger!Reub wrote: Tyler, can you please provide me with a chart showing me what will happen say for the next 12 months?
Thanks and Best Wishes!

Re: Portfolio Charts
Why?Mark Leavy wrote:Reub, I never suspected that frugal was your doppelg�nger!Reub wrote: Tyler, can you please provide me with a chart showing me what will happen say for the next 12 months?
Thanks and Best Wishes!
Live healthy, live actively and live life! 
-
Mark Leavy
- Executive Member
- Posts: 1950
- Joined: Thu Mar 01, 2012 10:20 pm
- Location: US Citizen, Permanent Traveler
Re: Portfolio Charts
Hi frugal.
You seem like a really happy and fun person that is very interested in finding new ways to rapidly and safely grow your money. In your exuberance, you sometimes make comments that seem either not well thought out or that make irrational requests of other forum members. Reub's humorous request followed by the "Thanks and Best Wishes!" just struck me as similar to your writing style.
I thoroughly appreciate all of the commenters here and the various backgrounds and biases that we all bring to the table. It is a lot of fun and a great group.
Re: Portfolio Charts
The real question is whether jafs is mathjak's doppelganger.
-
dualstow

- Executive Member
- Posts: 15671
- Joined: Wed Oct 27, 2010 10:18 am
- Location: searching for the lost Xanadu
- Contact:
Re: Portfolio Charts
I think that's been covered, and the answer is no, thank god.Reub wrote: The real question is whether jafs is mathjak's doppelganger.
Whistling tunes / We hide in the dunes by the seaside
Whistling tunes / We're kissing baboons in the jungle
Whistling tunes / We're kissing baboons in the jungle
Re: Portfolio Charts
Are we sure?
-
dualstow
- Executive Member
- Posts: 15671
- Joined: Wed Oct 27, 2010 10:18 am
- Location: searching for the lost Xanadu
- Contact:
Re: Portfolio Charts
Confident enough not to trouble jafs about it, anyway.Reub wrote: Are we sure?
And hey, if anyone -- jafs or otherwise -- becomes too much like mathjak, the admins can always give him the boot.
Whistling tunes / We hide in the dunes by the seaside
Whistling tunes / We're kissing baboons in the jungle
Whistling tunes / We're kissing baboons in the jungle
-
dualstow
- Executive Member
- Posts: 15671
- Joined: Wed Oct 27, 2010 10:18 am
- Location: searching for the lost Xanadu
- Contact:
Re: Portfolio Charts
Back on topic, why does the following portfolio have so much dark green compared to golden butterfly, even though it's so darn close to it in AA?
Replace Golden's Long Treas, Short Treas and Gold (all 20) with all 18%
12% each to midcap blend, smallcap blend, smallcap value.
10% to largecap blend.
Longest drawdown is one more year, worst year is bit worse, but that's a lot of dark green. Mid-dark. Not the darkest.
(I know, I know, averages lie, but this isn't a terribly rough ride).
Is it the extra stock?
Whistling tunes / We hide in the dunes by the seaside
Whistling tunes / We're kissing baboons in the jungle
Whistling tunes / We're kissing baboons in the jungle
Re: Portfolio Charts
Interesting.
My guess is that the extra small and mid cap tilt boosts the returns just enough to bump up many fields one color. Note that the color breaks are every 3%, but many of the light green GB fields are actually already above 5.5% (you can see them by mousing over individual squares). So it actually doesn't take much nudging to hit the next color break, and the practical difference may be smaller than the overall appearance implies.
My guess is that the extra small and mid cap tilt boosts the returns just enough to bump up many fields one color. Note that the color breaks are every 3%, but many of the light green GB fields are actually already above 5.5% (you can see them by mousing over individual squares). So it actually doesn't take much nudging to hit the next color break, and the practical difference may be smaller than the overall appearance implies.
-
dualstow
- Executive Member
- Posts: 15671
- Joined: Wed Oct 27, 2010 10:18 am
- Location: searching for the lost Xanadu
- Contact:
Re: Portfolio Charts
Thanks, Tyler. I was also thinking about the color breaks and how the Golden Butterfly must be pushing 6 in a lot of those cells, although I didn't know I could hover with the cursor.
Also, some portfolios merely distribute their lighter greens in a tricky way, making them look better (or worse) than similarly performing portfolios.
I had better stick with the numbers.
So I don't win a prize if I can make them all dark green?
Also, some portfolios merely distribute their lighter greens in a tricky way, making them look better (or worse) than similarly performing portfolios.
I had better stick with the numbers.
So I don't win a prize if I can make them all dark green?
Last edited by dualstow on Sat Dec 26, 2015 9:52 pm, edited 1 time in total.
Whistling tunes / We hide in the dunes by the seaside
Whistling tunes / We're kissing baboons in the jungle
Whistling tunes / We're kissing baboons in the jungle
Re: Portfolio Charts
Show me the portfolio that does that, and we'll both be famous! I do kinda like the idea of making a game out of it somehow.dualstow wrote: So I don't win a prize of I can make them all dark green?
-
dualstow
- Executive Member
- Posts: 15671
- Joined: Wed Oct 27, 2010 10:18 am
- Location: searching for the lost Xanadu
- Contact:
Re: Portfolio Charts
Easily outsourced to unskilled labor. 
But yes, it's fun!
But yes, it's fun!
Whistling tunes / We hide in the dunes by the seaside
Whistling tunes / We're kissing baboons in the jungle
Whistling tunes / We're kissing baboons in the jungle
Re: Portfolio Charts
It would be fairly trivial to write a program that tried every combination in, say, 1% increments to find the maximum number of dark green cells, or the greatest number of dark green cells with the minimum number of some other color. But what would this mean?
The optimum allocation last year, or over the last 5 years, or over the last 30 years is almost certainly not the optimum next year, or over the next 5 years, or over the next 30 years.
This relates to Harry Browne's rule #4: No one can predict the future.
Everyone knows the past. If determining the optimum portfolio allocation were as simple as maximizing some backward looking metrics there would certainly already be some smart fund manager who would be doing this.
Re: Portfolio Charts
PERFECTrickb wrote: It would be fairly trivial to write a program that tried every combination in, say, 1% increments to find the maximum number of dark green cells, or the greatest number of dark green cells with the minimum number of some other color. But what would this mean?
The optimum allocation last year, or over the last 5 years, or over the last 30 years is almost certainly not the optimum next year, or over the next 5 years, or over the next 30 years.
This relates to Harry Browne's rule #4: No one can predict the future.
Everyone knows the past. If determining the optimum portfolio allocation were as simple as maximizing some backward looking metrics there would certainly already be some smart fund manager who would be doing this.
Live healthy, live actively and live life!