Re: Yay PP!
Posted: Wed Jan 19, 2022 4:50 pm
From 11/30 2020
- portfolios.png (745.01 KiB) Viewed 8304 times
Permanent Portfolio Forum
https://www.gyroscopicinvesting.com/forum/
https://www.gyroscopicinvesting.com/forum/viewtopic.php?t=12433
Thanks for the info Mathjak. Its tough to know what is relevant in your comments, at least for me. You have alot of moving parts. SS, Pension, A newsletter you use to rebalance a combo of two buckets of funds that are actively managed that is...75 percent of your portfolio, the other part contains bitcoin.ppnewbie wrote: ↑Wed Jan 19, 2022 4:33 pmJust to understand a mix of these two funds makes up seventy five percent of your portfolio, correct? Can you reveal the specifics of those two funds because the site just says "Growth and Income" and "Income"?mathjak107 wrote: ↑Wed Jan 19, 2022 4:30 pm I don’t track performance since I retired and we are drawing out 6 figures a year ..only tracking I do personally is i compare balances left year to year …it’s the only thing that matters now
Any performance tracking I do is done by the newsletter in the models themselves and i use a mix of two of them .
Plus I also have my inflation hedge portfolio which I have in place .
So it really serves me no purpose trying to track what goes on personally ….we also have pension and ss going in to the same accounts too so it would be a crazy amount of work to track it personally since it serves me no purpose
The Dow/Gold ratio provides a reasonable indicator of when gold is expensive/Dow is cheap or vice versaPet Hog wrote: ↑Tue Jan 18, 2022 10:04 pmWe can see a similar thing in seajay's "non-rebalanced" PP from 1978 to today.mathjak107 wrote: ↑Sun Jan 16, 2022 3:45 pm Kitces looked into rebalancing .
Assuming a 50/50 with an average of 10% a year on equities and bonds averaging 5% , over 30 years the 50/50 would become 80/20 just letting assets drift
https://www.kitces.com/blog/how-rebalan ... nt-anyway/
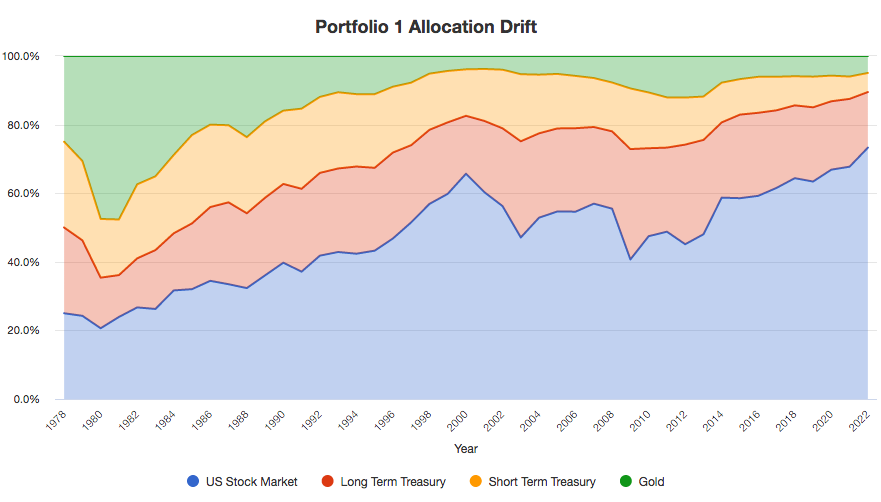
Looking at the "Allocation Drift" tab on Portfolio Visualizer gives the following chart. For a non-rebalanced PP started in January 1978, now 44 years later stocks are at 73%, LTTs at 16%, cash at 6%, and gold at 5%. That's a stock-to-LTT ratio of 82:18.seajay wrote: ↑Sun Jan 16, 2022 3:43 pm Rebalanced vs non-rebalanced and the two progression lines followed much the same lines, but where the non-rebalanced was seeing increased negative side portfolio volatility as early as the 4th year (-14% vs -5%)
Looking at the gold allocation, it seems there have been three great times to rebalance: around 1980 (get out), around 2000 (get in), and around 2012 (get out). Looking for a pattern, the last five years look similar to the five years up to around 1998 (with stock allocation up, LTTs sort of steady, and cash and gold both squeezed). So perhaps there'll soon be a next great time to get into gold. It certainly feels that way, intuitively, to me.
I did some "figuring" and it seems like you are at about 23ish percent equities and the rest mostly debt. I wonder if this is basically Wellesley + plus gold (with some bitcoin thrown in for some fuggazi rocket fuel).mathjak107 wrote: ↑Wed Jan 19, 2022 5:12 pm No idea …All I can tell you is what the individual models show since I only do a year end balance comparison AFTER OUR YEARLY SPENDING.
There are just to many moving parts in retirement because many pieces of the portfolio are in our taxable account we live on .
So money is always going in and coming out.. it is just to mind boggling with so much going on , especially when it is not a performance oriented portfolio to track short term events .
I reached a point that i want to go as conservative as I can , yet meet goal of staying a head of the previous years balance if we can or at least every two years should be a new high despite the spending down if we are down a year .
So far so good
Perhaps you could track this to realize how much money you ultimately cost yourself with your daytrading adventures.mathjak107 wrote: ↑Wed Jan 19, 2022 4:30 pm I don’t track performance since I retired and we are drawing out 6 figures a year ..only tracking I do personally is i compare balances left year to year …it’s the only thing that matters now
Any performance tracking I do is done by the newsletter in the models themselves and i use a mix of two of them .
Plus I also have my inflation hedge portfolio which I have in place .
So it really serves me no purpose trying to track what goes on personally ….we also have pension and ss going in to the same accounts too so it would be a crazy amount of work to track it personally and it serves me no purpose.
I care how the portfolios do as a whole so I can see what the income model does based on the newsletter tacking and I can see the growth model ..but how i mix them is not tracked by me
If he had this info, and disclosed it on this forum, everyone would realize him as the charlatan that he is.ppnewbie wrote: ↑Wed Jan 19, 2022 5:10 pmThanks for the info Mathjak. Its tough to know what is relevant in your comments, at least for me. You have alot of moving parts. SS, Pension, A newsletter you use to rebalance a combo of two buckets of funds that are actively managed that is...75 percent of your portfolio, the other part contains bitcoin.ppnewbie wrote: ↑Wed Jan 19, 2022 4:33 pmJust to understand a mix of these two funds makes up seventy five percent of your portfolio, correct? Can you reveal the specifics of those two funds because the site just says "Growth and Income" and "Income"?mathjak107 wrote: ↑Wed Jan 19, 2022 4:30 pm I don’t track performance since I retired and we are drawing out 6 figures a year ..only tracking I do personally is i compare balances left year to year …it’s the only thing that matters now
Any performance tracking I do is done by the newsletter in the models themselves and i use a mix of two of them .
Plus I also have my inflation hedge portfolio which I have in place .
So it really serves me no purpose trying to track what goes on personally ….we also have pension and ss going in to the same accounts too so it would be a crazy amount of work to track it personally since it serves me no purpose
So I want to figure out.
How many percentage points did your portfolio drop from Jan 31 2020 to March 31 2020. IE the big crash (just the fund part and then the whole portfolio and then the whole portfolio MINUS bitcoin).
When I get a moment I am going to throw all those funds with the 11/20 allocation.
I don’t think he’s a charlatan at all. However, without the numbers, there’s a lot of confidence in these posts in pretty much every nook anad cranny of this, a permanent portfolio forum, considering they go against the pp. Perhaps too much confidence.
i think that’s a fair suggestion.
Perhaps you could track this to realize how much money you ultimately cost yourself with your daytrading adventures.
dualstow wrote: ↑Wed Jan 19, 2022 6:23 pm
I don’t think he’s a charlatan at all. However, without the numbers, there’s a lot of confidence in these posts in pretty much every nook anad cranny of this, a permanent portfolio forum, considering they go against the pp. Perhaps too much confidence.
Perhaps you could track this to realize how much money you ultimately cost yourself with your daytrading adventures.
i think that’s a fair suggestion.
If he's going to hijack every thread, he better come with proof that he at least halfway knows what he's talking about. If his 'needs' don't involve tracking his yearly performance for his daytrading, then he shouldn't come on the forum saying the things that he says.yankees60 wrote: ↑Wed Jan 19, 2022 6:41 pmI don't.dualstow wrote: ↑Wed Jan 19, 2022 6:23 pmI don’t think he’s a charlatan at all. However, without the numbers, there’s a lot of confidence in these posts in pretty much every nook anad cranny of this, a permanent portfolio forum, considering they go against the pp. Perhaps too much confidence.i think that’s a fair suggestion.
Perhaps you could track this to realize how much money you ultimately cost yourself with your daytrading adventures.
I think it's a suggestion to fit others' needs. It's obvious that it is not Mathjak's need as he'd otherwise be doing it.
This feels close to me like fans saying they wish a certain athlete would retire so that they could keep a certain image of that athlete in their mind. It's that athlete's life and all that should matter is what that athlete thinks and not what any fan thinks.
I disagree on the specific point of at least attempting to back up what you say with something real.yankees60 wrote: ↑Wed Jan 19, 2022 6:41 pmI don't.dualstow wrote: ↑Wed Jan 19, 2022 6:23 pmI don’t think he’s a charlatan at all. However, without the numbers, there’s a lot of confidence in these posts in pretty much every nook anad cranny of this, a permanent portfolio forum, considering they go against the pp. Perhaps too much confidence.i think that’s a fair suggestion.
Perhaps you could track this to realize how much money you ultimately cost yourself with your daytrading adventures.
I think it's a suggestion to fit others' needs. It's obvious that it is not Mathjak's need as he'd otherwise be doing it.
This feels close to me like fans saying they wish a certain athlete would retire so that they could keep a certain image of that athlete in their mind. It's that athlete's life and all that should matter is what that athlete thinks and not what any fan thinks.
Well said.vincent_c wrote: ↑Wed Jan 19, 2022 8:06 pm MJ said it himself that an investment should be evaluated based on its long term performance, yet it seems to only apply to stocks.
When it comes to the PP, then somehow he can't understand that gold has had the longest track record of keeping its purchasing power over time but no, we must look at the price movement today and how it responds to changes in interest rate expectations in the short term.
When it comes to long term treasuries, he can't understand that a constant duration fixed income portfolio is basically constantly reinvesting in bonds that will be maturing a long time from now, yet it again is important how they respond to interest rate changes in the short term.
When it comes to cash, he can't understand that it is an option to buy the other assets at a cheaper price some time in the future but no it has to be a drag on the portfolio's return and is guaranteed to lose money to inflation.
But stocks are fine, even when they can fall to the point where circuit breakers are triggered multiple times a day and yet the under 1% daily volatility of the PP isn't what PP investors probably signed up for. I know exactly what I've signed up for in the PP, I evaluate those assumptions on a daily basis and nothing is broken right now. If things break then I'll be the first to sound the alarm.
Jumping in, reminded of ...
The income model is too tilted towards inflation. It's not going to do well in this deflationary environment.mathjak107 wrote: ↑Thu Jan 20, 2022 2:35 am I I know exactly how each individual portfolio does and my own results are in between the income model and the growth model ..I have no reason to get in to the weeds with a lot of calculations .
What I do take interest in is how just the income model compares to the pp since they are the same equity allocation only the income model is more conservative then the pp as the assets surrounding the equities are less volatile….
The pp should have better returns taking on more risk in the other assets.. however I am interested if that is still going to be the case since last year when the rate and inflation fears began ..so far the pp lagged it last year and is behind it in this years sell off. So it isn’t a case of just 19 days .
So you have it backwards ….the pp SHOULD DO better then the more conservative income model but my whole theory is I don’t think that is going to be the case in rising rates and inflation fears.
I think there is to much drag in this new environment on the pp and the pp is riskier and may not see the reward for the extra rate risk
I agree , I have been Saying that all along ..however that is what we seem to ge stuck in and the fed is not going to have a lot in their arsenal to combat inflation without really upsetting the Apple cart .dockinGA wrote: ↑Thu Jan 20, 2022 7:17 amThe income model is too tilted towards inflation. It's not going to do well in this deflationary environment.mathjak107 wrote: ↑Thu Jan 20, 2022 2:35 am I I know exactly how each individual portfolio does and my own results are in between the income model and the growth model ..I have no reason to get in to the weeds with a lot of calculations .
What I do take interest in is how just the income model compares to the pp since they are the same equity allocation only the income model is more conservative then the pp as the assets surrounding the equities are less volatile….
The pp should have better returns taking on more risk in the other assets.. however I am interested if that is still going to be the case since last year when the rate and inflation fears began ..so far the pp lagged it last year and is behind it in this years sell off. So it isn’t a case of just 19 days .
So you have it backwards ….the pp SHOULD DO better then the more conservative income model but my whole theory is I don’t think that is going to be the case in rising rates and inflation fears.
I think there is to much drag in this new environment on the pp and the pp is riskier and may not see the reward for the extra rate risk
Bitcoinmathjak107 wrote: ↑Thu Jan 20, 2022 10:02 am Nice attempt for what it’s worth …your more ambitious than I am. It does backtest well .
Now I need to name it
I think wellsely is close although wellesly does hold a fair amount of long term bonds .
Wellesly is a fine fund for retirement