So I ran some figures using Simba spreadsheet for data from 1871 comparing the annualized gains and 30 year withdrawal rates for each of 33/67 TSM/TBM to 50/50 TSM/PM, 50/50 TSM/TBM to 67/33 TSM/PM, and 67/33 TSM/TBM to 75/25 TSM/PM ... i.e. shift bond risk over to the stock side but instead of T-Bills opting for Precious Metals. In each case the TSM/TBM rewarded a bit more, with more volatility. Noteworthy however is that 67/33 TSM/TBM was very close to that of 50/50 TSM/PM, near exactly the same risk (volatility) and reward.Seems like this 75/25 stock/cash AA would be especially valuable in retirement. No interest rate risk.Second, there always has been a segment of Bogleheads (supported by research) that prefers to have a higher stock allocarion and use cash equivalents for their fixed income. So instead of 60/40 stocks/bonds, they use 75/25 stocks/cash
50/50 Stock/Gold vs 67/33 stock/bond
Moderator: Global Moderator
50/50 Stock/Gold vs 67/33 stock/bond
This post over on BH https://www.bogleheads.org/forum/viewto ... 6#p7485516 caught my eye, in particular ...
-
whatchamacallit
- Executive Member

- Posts: 751
- Joined: Mon Oct 01, 2012 7:32 pm
Re: 50/50 Stock/Gold vs 67/33 stock/bond
Isn't 67/33 Stock/Gold even better than 50/50 Stock/Gold though?
Re: 50/50 Stock/Gold vs 67/33 stock/bond
As a comparison to 67/33 stock/bond (a typical BH asset allocation) however, 50/50 stock/PM historically compared well. US data real annualised since 1871 both 5.7%, 30 year worst maxWR% 4.16% vs 4.17% (67/33 TSM/TBM vs 50/50 TSM/PM respectively), median case 30 year maxWR% 6.46% vs 6.47%.whatchamacallit wrote: ↑Mon Oct 02, 2023 4:25 pm Isn't 67/33 Stock/Gold even better than 50/50 Stock/Gold though?
Out of sample and UK since 1896 comparison of 67/33 stock/bond to 50/50 stock/PM and the ratio broadly aligned, but with significant deviation (and mean-reversion) at times
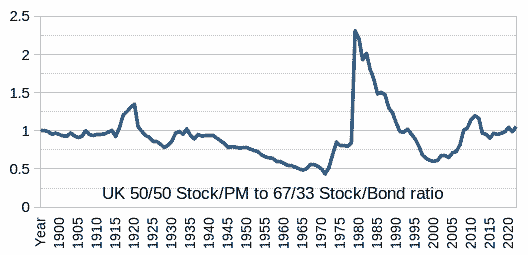
That tells a story. From the 1930's and gold was no longer the primary currency, lost its appeal, up until the 1970's when doubts arose about the dollar replacement currency and there was a sharp rise in the price of gold (and silver) former currency. Interest rates paid against the dollar rose into double digits as was inflation in terms of dollars high. Concerns however progressively faded to see the dollar strengthen, interest rates progressively declined and by the mid 1990's had fully recovered, but that then continued on further (momentum/greed) up to the 1999 peak of greed/momentum. Since then and things have mean-reverted and I'd conjecture that having done so, re-found the 1.0 level that could be the natural tendency level. Deviations either side might be indicative of the price of gold being relatively cheap/expensive.
Increasing stock such as to 67/33 levels being no different to a 33/67 blend of 33% in 100% stock and 67% in 50/50 stock/gold, that might be inclined to yield a higher total return/reward in view of higher risk exposure (and volatility). A tendency for a 'better' reward, but with higher volatility (risk). Better (maybe) in total return, but generally comparable on a risk/reward measure.