seajay wrote: ↑Tue Nov 08, 2022 10:01 am
mathjak107 wrote: ↑Tue Nov 08, 2022 4:24 am
His premise that a balanced portfolio can only support a draw rate in the 3% range is unfounded ….
Mathematically A failure of 4% needs to see less then a 2% real return the first 15 years of a 30 year retirement.
There is nothing since 1966 that has done that
Overdue then

10 years of 0% or lower total real are infrequent, once in every 50 years or so average events. If you hit a -2% real decade whilst also drawing 4%, to end up more than -60% down (real), then the 4% SWR relative to the ongoing 40% left = 10%+ SWR value relative to the ongoing portfolio value. Can still work out OK as a poor decade is often followed by a great decade, but close to the wire. For a average 30 year horizon that's a 60% chance of occurrence. 40% might get away without such a potentially critical hit during their drawdown time. Also helpful is that if you instead started a couple/few years either side of that date then prior gains or later less down's can also side step that risk. Maybe only actually hurting a relatively small percentage of retirees who just simply retired at the wrong point in time. But even then, their money might still last 25 years, instead of the 30 years that SWR is typically measured across, whilst a 65 year old may not get to be 90 let alone 95.
If you time diversify into retirement, start one SWR run a year before you actually retire, as though you were retired, but let the income build up in a cash account - with one third of the total. Then another run started the day you do retire with the another third - with the income from that supplemented with the cash you'd already accumulated from the first run. Then a third run, a year later with the last third. Averaging three sequential/overlapping 30 year SWR runs in such a manner will avoid having lumped all in at the worst point in time. Alleviate the likes of a 1969 (? 1966) bad start date. Three separate portfolios - but where if one does start straining another might have spare capacity, such that revising the poorer case to a lower 3% SWR value, increasing another to 5% (or other two to 4.5%) may see you through OK. Does leave you a little short on income in the first year of retirement, but that might be sorted by having built up a bit of additional cash to cover that before deciding that you'll retire 'next year'.
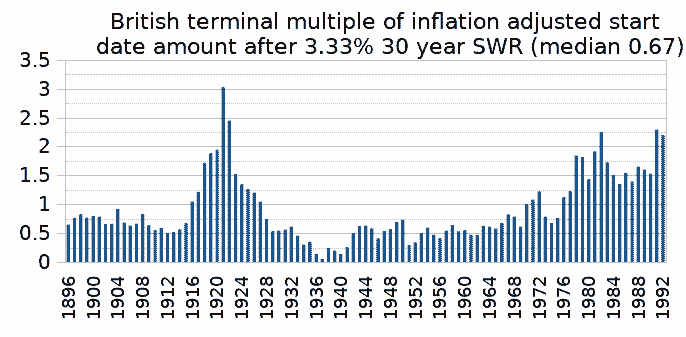
Was there ever a 30 year period where you didn't get the return of your inflation adjusted money, via 30 year 3.33% SWR with a PP?
PV Monte Carlo suggests a very small probability of not doing so. Similar also for 50/50 TSM/10 year Treasury. Less so for 100% TSM (95% probability).
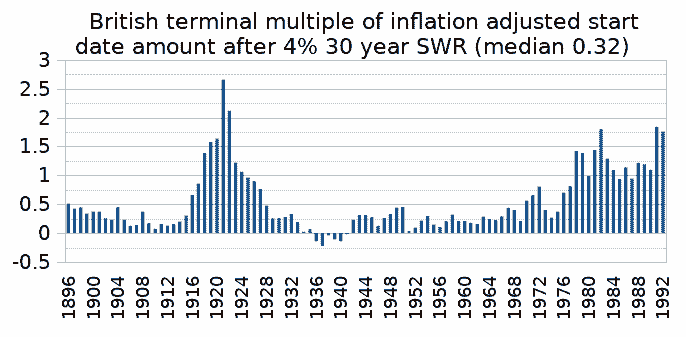
a 60/40 has had 5 failures where over the 30 years retirees failed to hold 4% if they started in these years.
1907, 1929,1937,1965.1966
FIRECalc looked at the 122 possible 30 year periods in the available data, starting with a portfolio of $1,000,000 and spending your specified amounts each year thereafter.
Here is how your portfolio would have fared in each of the 122 cycles. The lowest and highest portfolio balance at the end of your retirement was $-272,474 to $4,564,899, with an average at the end of $1,434,120. (Note: this is looking at all the possible periods; values are in terms of the dollars as of the beginning of the retirement period for each cycle.)
For our purposes, failure means the portfolio was depleted before the end of the 30 years. FIRECalc found that 5 cycles failed, for a success rate of 95.9%.
------------------------------------------------------------------------------------------
50/50 failed 6x so one more date failed but not sure off hand which one , I can’t read the graph on my iPad .
IRECalc looked at the 122 possible 30 year periods in the available data, starting with a portfolio of $1,000,000 and spending your specified amounts each year thereafter.
Here is how your portfolio would have fared in each of the 122 cycles. The lowest and highest portfolio balance at the end of your retirement was $-223,952 to $4,145,063, with an average at the end of $1,159,395. (Note: this is looking at all the possible periods; values are in terms of the dollars as of the beginning of the retirement period for each cycle.)
For our purposes, failure means the portfolio was depleted before the end of the 30 years. FIRECalc found that 6 cycles failed, for a success rate of 95.1%.
--------------------------------------------------------------------------------------------------
40/60 failed 8x
FIRECalc looked at the 122 possible 30 year periods in the available data, starting with a portfolio of $1,000,000 and spending your specified amounts each year thereafter.
Here is how your portfolio would have fared in each of the 122 cycles. The lowest and highest portfolio balance at the end of your retirement was $-187,735 to $3,751,122, with an average at the end of $910,974. (Note: this is looking at all the possible periods; values are in terms of the dollars as of the beginning of the retirement period for each cycle.)
For our purposes, failure means the portfolio was depleted before the end of the 30 years. FIRECalc found that 8 cycles failed, for a success rate of 93.4%
---------------------------------------------------------------------------------------------------------------
30/70 failed 15x and is considered unsafe at 4%
FIRECalc looked at the 122 possible 30 year periods in the available data, starting with a portfolio of $1,000,000 and spending your specified amounts each year thereafter.
Here is how your portfolio would have fared in each of the 122 cycles. The lowest and highest portfolio balance at the end of your retirement was $-206,630 to $3,368,918, with an average at the end of $689,177. (Note: this is looking at all the possible periods; values are in terms of the dollars as of the beginning of the retirement period for each cycle.)
For our purposes, failure means the portfolio was depleted before the end of the 30 years. FIRECalc found that 15 cycles failed, for a success rate of 87.7%.