Monthly is all I use.
Please meet Global Navigator and The Russell
Moderator: Global Moderator
-
StrategyDriven

- Senior Member

- Posts: 135
- Joined: Thu Jul 09, 2020 5:58 pm
Re: Please meet Global Navigator and The Russell
Siamond had Ken French actually calculate monthly total returns and not just annual; this was a few years back (circa 2018ish/2019ish IIRC). Tyler over at Portfoliocharts calculated monthly TRs as well. Please check your PM inbox.StrategyDriven wrote: ↑Tue Apr 06, 2021 5:51 pmSiamond's data is no good for testing because it is annual, gotta have monthly to backtest on it for strategies like mine. I'm not familiar with those crashes you mentioned in the 1930's and 1940's, but if it's something like the Flash Crash, that can't be avoided unless there was previous downturns in the market which signaled an exit (similar to how we got out at the end of February 2020, avoiding the bigger drop in March.D1984 wrote: ↑Tue Apr 06, 2021 5:28 pmGood to know.StrategyDriven wrote: ↑Mon Apr 05, 2021 6:02 pmbtw - I just recalled hearing Meb Faber talk about Black Monday, and that if your timing strategy was faster than a 200 day, you got out before the tumble, which means that my strategies would have all been out before that day, they move faster than 200 by quite a lot. This past year they got out of the markets at the end of February. The Pro is getting in and out a bit quicker, the Con is sometimes whipsaw.
I wonder what would happen to strategies like these in a sudden no-warning "thunderbolt out of the blue" crash like in May 1940, March 1939, or March 1938 (although for that last one equities might've been in enough of a downtrend already that the system would've been in bonds by then anyhow). I know the Russell indexes don't go back that far but there might be a good enough substitute....see, both Siamond on the Bogleheads board (they used data from Ken French at Dartmouth) and Tyler--of this very board and of PortfolioCharts fame--(he used CRSP data IIRC) have computed monthly TR indexes for all nine sectors of the style box (i.e. LCG, LCB, LCV, MCG, MCB, MCV, SCG, SCB, SCV) going back to the mid-1920s. These should be fairly accurate proxies for their respective equivalent Russell indices (i.e. LCB for Russell 1000, MCG for Russell Midcap Growth, SCV, for Russell 2000 Value, etc) since Russell doesn't have earnings quality and positive-for-at-least-four-quarters earnings requirements for entry into its indices like S&P does (for instance, recall that Tesla was only allowed into the S&P 500 when it could show four consecutive quarters of positive earnings); Russell just requires the companies to be of the proper size for the index category (for instance, large-cap for the Russell 1000) and being value or growth stocks for the value or growth sub-index versions of its indices.
If I could get you this data as well could you please run the backtests on these back to 1926 or 1927 (if you need monthly LTT or ITT data back that far Siamond at Bogleheads should have that as well)?
Last edited by D1984 on Wed Apr 07, 2021 11:46 pm, edited 1 time in total.
Re: Please meet Global Navigator and The Russell
Re: Please meet Global Navigator and The Russell
For Total US Market - try https://fred.stlouisfed.org/series/WILL5000IND or https://fred.stlouisfed.org/series/WILL5000INDFC ; I believe one of these is the TR data (with dividends reinvested); https://fred.stlouisfed.org/series/WILL5000PR is the price only (i.e. no dividends) data. The Wilshire 5000 TR data goes back to 1970 or so, I believe; I can get access to CRSP US total maret data as well but the version I have only goes back to 1989 rather than 1926 (which is where the full version starts at).StrategyDriven wrote: ↑Tue Apr 06, 2021 5:51 pmRegarding back testing, if I can get Total US Market, or even just S&P 500 monthly total return data AND a T-Bill/CASHX type monthly total return then I can tell you which months the strategies would have been out of equities. Testing on IWB and VTI or SPY does make small differences, I use IWB for my strategies which use Russell Components, and VTI for Global Navigator which has no Russell components. But they're all extremely similar other than maybe a month here or there which is in vs out.D1984 wrote: ↑Tue Apr 06, 2021 5:28 pmGood to know.StrategyDriven wrote: ↑Mon Apr 05, 2021 6:02 pmbtw - I just recalled hearing Meb Faber talk about Black Monday, and that if your timing strategy was faster than a 200 day, you got out before the tumble, which means that my strategies would have all been out before that day, they move faster than 200 by quite a lot. This past year they got out of the markets at the end of February. The Pro is getting in and out a bit quicker, the Con is sometimes whipsaw.
I wonder what would happen to strategies like these in a sudden no-warning "thunderbolt out of the blue" crash like in May 1940, March 1939, or March 1938 (although for that last one equities might've been in enough of a downtrend already that the system would've been in bonds by then anyhow). I know the Russell indexes don't go back that far but there might be a good enough substitute....see, both Siamond on the Bogleheads board (they used data from Ken French at Dartmouth) and Tyler--of this very board and of PortfolioCharts fame--(he used CRSP data IIRC) have computed monthly TR indexes for all nine sectors of the style box (i.e. LCG, LCB, LCV, MCG, MCB, MCV, SCG, SCB, SCV) going back to the mid-1920s. These should be fairly accurate proxies for their respective equivalent Russell indices (i.e. LCB for Russell 1000, MCG for Russell Midcap Growth, SCV, for Russell 2000 Value, etc) since Russell doesn't have earnings quality and positive-for-at-least-four-quarters earnings requirements for entry into its indices like S&P does (for instance, recall that Tesla was only allowed into the S&P 500 when it could show four consecutive quarters of positive earnings); Russell just requires the companies to be of the proper size for the index category (for instance, large-cap for the Russell 1000) and being value or growth stocks for the value or growth sub-index versions of its indices.
If I could get you this data as well could you please run the backtests on these back to 1926 or 1927 (if you need monthly LTT or ITT data back that far Siamond at Bogleheads should have that as well)?
As for the S&P 500 TR the issue is that there wasn't actually a "true" S&P 500 TR until March 1957; if you look at the historical "S&P 500 TR" data there are at LEAST six or seven different version running around (the Cowles one from 1871 to the late 1930s--this is the earliest one and the one Shiller uses for his S&P and CAPE dataset portion from 1871 to 1936 or so; the S&P 233 Composite from 1923, the S&P 90 Composite starting in 1926, the one starting in 1936, the one starting in 1970, the one starting in 1976 when financial stocks were first included, the one starting in 1988 or 1989 when daily TR data with dividends was provided, the "CRSP version of the S&P 500" using all the stocks on the NYSE, and various "S&P" composites with anywhere from 198 stocks--in 1918--to 480 stocks--in the mid-1950s--and that in some cases actually predate the 1941 merger between Standard Statistics and Poor's Publishing that created the modern-day Standard and Poor's Co).
For more background on all these (including with some useful links giving monthly and/or daily TR returns for the 1936, 1970, and late 1980s version of the S&P 500) see the following websites:
https://www.bogleheads.org/forum/viewtopic.php?t=191038
https://www.bogleheads.org/forum/viewtopic.php?t=227756
https://www.benbest.com/business/indexusa.html
https://www.cftech.com/the-brainbank-ar ... poor-s-500
https://www.jstor.org/stable/pdf/10.1086/339903.pdf
Finally, if you want monthly TRs for the S&P 500 (no idea which of the above versions or whether indeed it is a concatenated splice of several of the above indexes) the 1928-72 data is at https://static.seekingalpha.com/uploads ... origin.png ; the 1973-2017 data is at https://static.seekingalpha.com/uploads ... origin.png
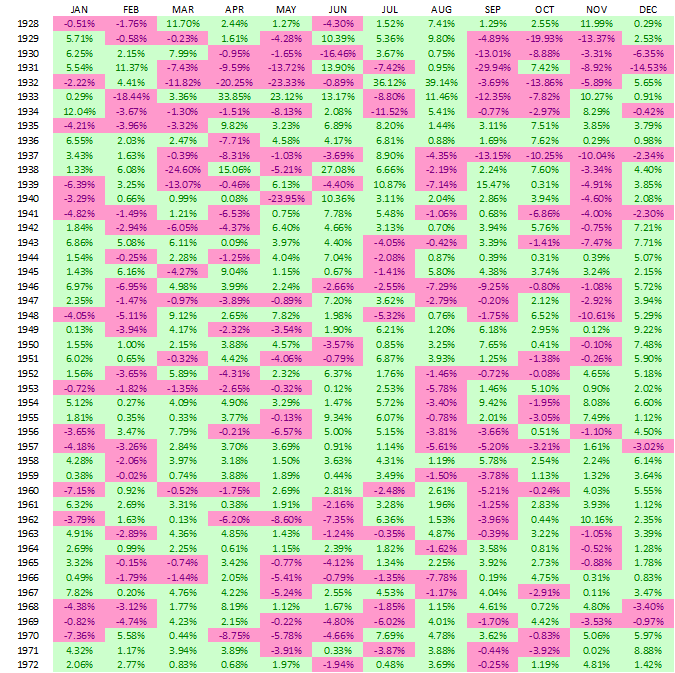
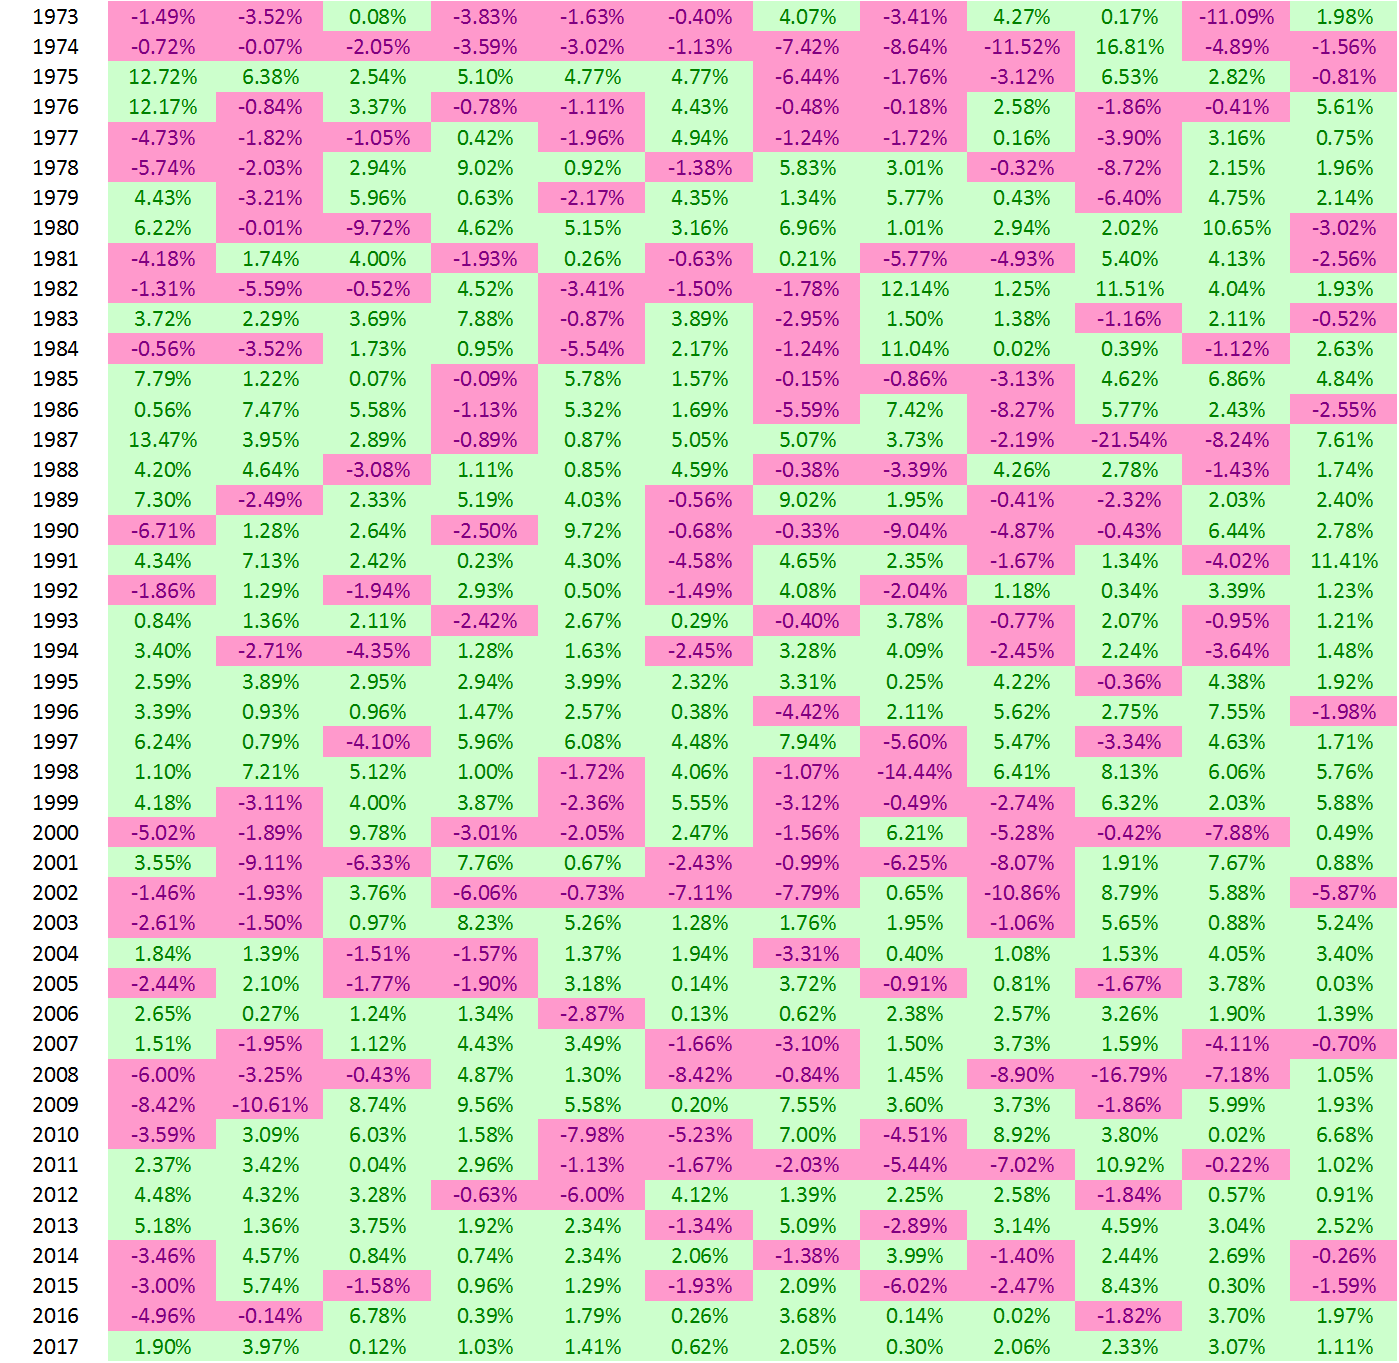
As far as T-bill/cash total return data goes I'm still working on it; I should be able to provide a series back to at least the late 1930s or early 1940s.
-
StrategyDriven
- Senior Member
- Posts: 135
- Joined: Thu Jul 09, 2020 5:58 pm
Re: Please meet Global Navigator and The Russell
Awesome, I only ever saw annual in his big file, I am out of town for a few days but will check this out when I return. Thank you.D1984 wrote: ↑Wed Apr 07, 2021 11:46 pm
https://gofile.io/d/vWcOca
Is this S&P or also including a safe return asset like T-Bill too?
-
StrategyDriven
- Senior Member
- Posts: 135
- Joined: Thu Jul 09, 2020 5:58 pm
Re: Please meet Global Navigator and The Russell
I've got the monthly US Total Market data, but can only find monthly 13 week T-Bill data back to 1985 and then annual before that date back to 1928. I can run it using annual T-Bill but monthly would be better if anybody can source it. I need the T-Bill rate to determine when the strategies are in equities or in Treasuries.D1984 wrote: ↑Wed Apr 07, 2021 11:46 pm
https://gofile.io/d/vWcOca
Re: Please meet Global Navigator and The Russell
I think this one is Russell data (R2K i.e. Russell 2000 which is the smallcap blend Russell index, R2K Value, R2K Growth, Russell Midcap, Russell Midcap growth, Russell Midcap value, Russell 1000, and Russell 3000) in TR format which includes reinvested dividends.StrategyDriven wrote: ↑Thu Apr 08, 2021 9:30 amAwesome, I only ever saw annual in his big file, I am out of town for a few days but will check this out when I return. Thank you.D1984 wrote: ↑Wed Apr 07, 2021 11:46 pm
https://gofile.io/d/vWcOca
Is this S&P or also including a safe return asset like T-Bill too?
Russell 1000 is the largecap index and is basically Russell''s equivalent of the S&P 500; Russell 2000 is their equivalent of the S&P 600, Russell Midcap is their equivalent of the S&P 400, and Russell 3000 is Russell's closest equivalent to a TSM index.
Re: Please meet Global Navigator and The Russell
StrategyDriven wrote: ↑Sun Apr 11, 2021 6:53 pmI've got the monthly US Total Market data, but can only find monthly 13 week T-Bill data back to 1985 and then annual before that date back to 1928. I can run it using annual T-Bill but monthly would be better if anybody can source it. I need the T-Bill rate to determine when the strategies are in equities or in Treasuries.D1984 wrote: ↑Wed Apr 07, 2021 11:46 pm
https://gofile.io/d/vWcOca
Hang on, I can get the T-Bill data back to mid or late 1941. Give me a little while but I should be able to get it soon. It will be back to 1941 but I can also show you how to (manually....you'll have to enter the data into Excel yourself) get T-bill monthly for the 15 or so years before that and actually (since the Fedgov didn't really issue true T-bills as we now them today before the early 1920s) before that since it will be the closest thing to a "risk-free" money market rate that existed before T-bills were issued....all the way back to 1890 if you're interested. The Fed compiled this data monthly for their Banking and Monetary Statistics series that they published in early 1942 (the 1914-41 data) and again in early 1971 (the 1941-70 data).
Re: Please meet Global Navigator and The Russell
https://easyupload.io/2co005StrategyDriven wrote: ↑Sun Apr 11, 2021 6:53 pmI've got the monthly US Total Market data, but can only find monthly 13 week T-Bill data back to 1985 and then annual before that date back to 1928. I can run it using annual T-Bill but monthly would be better if anybody can source it. I need the T-Bill rate to determine when the strategies are in equities or in Treasuries.D1984 wrote: ↑Wed Apr 07, 2021 11:46 pm
https://gofile.io/d/vWcOca
This is 3-month T-Bill TR back to 1-31-1941. For the month of January 1941 (i..e from 12-31-40 or 1-1-41 all the way to 1-31-41) just take the annual yield on T-bills (around 0.055% or 0.06% IIRC...it was a tiny amount; T-Bills yielded basically nothing by that point) and divide it by 12 (or maybe 12.3 or so to account for annualized compounding of the monthly returns...but again, with yields on T-Bills as low as they were annualized compounding of the monthly returns wouldn't really add anything anyway) to get the monthly interest return for January; this should be the equivalent of the whole total return for the month of January 1941 since T-bills have only an interest return but no capital gain or loss.
For 1940, 1939, and most of 1938 T-bill yields were so low (as per the Federal Reserve Banking and Monetary Statistics 1914-41 document mentioned above....it has monthly T-bill yields from 1929 onwards and monthly 3-6 month Treasury yields from 1920-1929) that they typically ranged from 0.101% to 0.003%--and those are ANNUAL return yields (well, annualized from a monthly basis), not monthly, which again is about as close to nothing as you can get.....it comes to an annual interest payment of between one dollar (for the highest rate of 0.101%) and less than one cent (for the lowest rate of 0.003%) on a $1,000 investment in T-Bills.
-
StrategyDriven
- Senior Member
- Posts: 135
- Joined: Thu Jul 09, 2020 5:58 pm
Re: Please meet Global Navigator and The Russell
Can you point me to the monthly return data in the Simba spreadsheet? I just downloaded the latest Backtest-Portfolio-returns-rev20b LETF and do not see anything but annual.
Re: Please meet Global Navigator and The Russell
The siamond/SImba monthly data wasn't on that spreadsheet; I PM'd the link to the siamond monthly total return data (and Tyler's very similar data) to you; if it accidentally got deleted I can send you a new link. IIRC the siamond data was in .txt format and the Tyler/Portfoliocharts data was in XLS or CSV format. Just let me know and I'll send it if need be.StrategyDriven wrote: ↑Tue Apr 13, 2021 5:54 pmCan you point me to the monthly return data in the Simba spreadsheet? I just downloaded the latest Backtest-Portfolio-returns-rev20b LETF and do not see anything but annual.
-
StrategyDriven
- Senior Member
- Posts: 135
- Joined: Thu Jul 09, 2020 5:58 pm
Re: Please meet Global Navigator and The Russell
I got the one with the uS market returns in various forms but no LTTD1984 wrote: ↑Tue Apr 13, 2021 8:17 pmThe siamond/SImba monthly data wasn't on that spreadsheet; I PM'd the link to the siamond monthly total return data (and Tyler's very similar data) to you; if it accidentally got deleted I can send you a new link. IIRC the siamond data was in .txt format and the Tyler/Portfoliocharts data was in XLS or CSV format. Just let me know and I'll send it if need be.StrategyDriven wrote: ↑Tue Apr 13, 2021 5:54 pmCan you point me to the monthly return data in the Simba spreadsheet? I just downloaded the latest Backtest-Portfolio-returns-rev20b LETF and do not see anything but annual.
Re: Please meet Global Navigator and The Russell
OK, I'll see what I can up with for LTTs (neither of those spreadsheets had LTT on them--they just had equity return data for various market caps and styles--but I think for the latest iteration siamond and a few other Bogleheads did calculate monthly LTT, ITT, and STT returns in addition to just annual ones. I'll have to go back there and check.StrategyDriven wrote: ↑Tue Apr 13, 2021 8:21 pmI got the one with the uS market returns in various forms but no LTTD1984 wrote: ↑Tue Apr 13, 2021 8:17 pmThe siamond/SImba monthly data wasn't on that spreadsheet; I PM'd the link to the siamond monthly total return data (and Tyler's very similar data) to you; if it accidentally got deleted I can send you a new link. IIRC the siamond data was in .txt format and the Tyler/Portfoliocharts data was in XLS or CSV format. Just let me know and I'll send it if need be.StrategyDriven wrote: ↑Tue Apr 13, 2021 5:54 pmCan you point me to the monthly return data in the Simba spreadsheet? I just downloaded the latest Backtest-Portfolio-returns-rev20b LETF and do not see anything but annual.
Worst comes to worst we can always just use the monthly Ibbotson Long-Term Government TR data but that isn't an exact equivalent to VUSTX or TLT; the Ibbotson data just assumes a 20-year T-bond that is simply rolled over (along with any accrued interest for that month) to buy another newly issued 20-year T-bond, and rinse and repeat this process on the first of each month.
Meanwhile, here is the T-Bill TR data monthly for 1939, 1940, and 1941 (I tried to PM it to you but for some reason the PM didn't appear in my outbox or sent messages so I don't know if it got sent or not).
https://filebin.net/s6k1cnopgpps7qf7
-
StrategyDriven
- Senior Member
- Posts: 135
- Joined: Thu Jul 09, 2020 5:58 pm
Re: Please meet Global Navigator and The Russell
I'm not sure, but the T-Bill data looks like it's yield based, and not the actual monthly fluctuations of the securitized traded t-bill product.D1984 wrote: ↑Tue Apr 13, 2021 9:13 pm
Meanwhile, here is the T-Bill TR data monthly for 1939, 1940, and 1941 (I tried to PM it to you but for some reason the PM didn't appear in my outbox or sent messages so I don't know if it got sent or not).
https://filebin.net/s6k1cnopgpps7qf7
Re: Please meet Global Navigator and The Russell
Perhaps a dumb question but.....at those tiny yields would there be much of a fluctuation in price (unless yields increased sharply and almost instantly from, say 0.02% to upwards of 1% or so.....but over these three years that never came remotely close to happening)? Most of the backtests I've seen assume that T-bills are essentially like a money market account and the only return is from the yield and thus ignore any minor price fluctuations (i.e. since the bill is due to mature in 3 months--or less--they assume that there would be little to no price fluctuation anyhow).StrategyDriven wrote: ↑Tue Apr 13, 2021 9:23 pmI'm not sure, but the T-Bill data looks like it's yield based, and not the actual monthly fluctuations of the securitized traded t-bill product.D1984 wrote: ↑Tue Apr 13, 2021 9:13 pm
Meanwhile, here is the T-Bill TR data monthly for 1939, 1940, and 1941 (I tried to PM it to you but for some reason the PM didn't appear in my outbox or sent messages so I don't know if it got sent or not).
https://filebin.net/s6k1cnopgpps7qf7
-
StrategyDriven
- Senior Member
- Posts: 135
- Joined: Thu Jul 09, 2020 5:58 pm
Re: Please meet Global Navigator and The Russell
I created a spreadsheet to be able to see any of the strategies vs the S&P 500, you pick the strategy, the starting year, and how many years and it charts it.
It won't display properly on DroidDoc, but you can download the file and play with it on your computerDownload the spreadsheet from here, as of 04/14/2021
It won't display properly on DroidDoc, but you can download the file and play with it on your computerDownload the spreadsheet from here, as of 04/14/2021
-
StrategyDriven
- Senior Member
- Posts: 135
- Joined: Thu Jul 09, 2020 5:58 pm
Re: Please meet Global Navigator and The Russell
Take a look at the last three months of price action of BIL, doesn't really represent the recent 13 week treasury yields.D1984 wrote: ↑Tue Apr 13, 2021 9:43 pmPerhaps a dumb question but.....at those tiny yields would there be much of a fluctuation in price (unless yields increased sharply and almost instantly from, say 0.02% to upwards of 1% or so.....but over these three years that never came remotely close to happening)? Most of the backtests I've seen assume that T-bills are essentially like a money market account and the only return is from the yield and thus ignore any minor price fluctuations (i.e. since the bill is due to mature in 3 months--or less--they assume that there would be little to no price fluctuation anyhow).StrategyDriven wrote: ↑Tue Apr 13, 2021 9:23 pmI'm not sure, but the T-Bill data looks like it's yield based, and not the actual monthly fluctuations of the securitized traded t-bill product.D1984 wrote: ↑Tue Apr 13, 2021 9:13 pm
Meanwhile, here is the T-Bill TR data monthly for 1939, 1940, and 1941 (I tried to PM it to you but for some reason the PM didn't appear in my outbox or sent messages so I don't know if it got sent or not).
https://filebin.net/s6k1cnopgpps7qf7

-
StrategyDriven
- Senior Member
- Posts: 135
- Joined: Thu Jul 09, 2020 5:58 pm
Re: Please meet Global Navigator and The Russell
StrategyDriven wrote: ↑Wed Apr 14, 2021 1:49 pm I created a spreadsheet to be able to see any of the strategies vs the S&P 500, you pick the strategy, the starting year, and how many years and it charts it.
It won't display properly on DroidDoc, but you can download the file and play with it on your computerDownload the spreadsheet from here, as of 04/14/2021
-
Kriegsspiel

- Executive Member
- Posts: 4052
- Joined: Sun Sep 16, 2012 5:28 pm
Re: Please meet Global Navigator and The Russell
By the way, yes. These different strategies some of you forumites are into are interesting to read about.StrategyDriven wrote: ↑Mon Apr 05, 2021 1:57 pm Hello?
Just checking, is anybody here other than modeljc following along here to some degree or another? I thought this was a place where these strategies would be welcomed and well appreciated, but it's been pretty much crickets other than some back and forth with modeljc.
You there, Ephialtes. May you live forever.
Re: Please meet Global Navigator and The Russell
Yes, but it only seems to have declined during this period by around 0.03% (that's three one-hundredths of one percent) in pure price terms if you go by 91.50 (or even 91.49) divided by its starting price of just under 91.52. Like I said before, virtually nothing. A sudden spike in rates might change things but 1-3 month T-bills have such low duration anyhow that it would require a pretty decent-sized rate spike to cause them to move much in price. There was no such sudden good-sized spike in rates from 1939 to 1941.StrategyDriven wrote: ↑Wed Apr 14, 2021 1:52 pmTake a look at the last three months of price action of BIL, doesn't really represent the recent 13 week treasury yields.D1984 wrote: ↑Tue Apr 13, 2021 9:43 pmPerhaps a dumb question but.....at those tiny yields would there be much of a fluctuation in price (unless yields increased sharply and almost instantly from, say 0.02% to upwards of 1% or so.....but over these three years that never came remotely close to happening)? Most of the backtests I've seen assume that T-bills are essentially like a money market account and the only return is from the yield and thus ignore any minor price fluctuations (i.e. since the bill is due to mature in 3 months--or less--they assume that there would be little to no price fluctuation anyhow).StrategyDriven wrote: ↑Tue Apr 13, 2021 9:23 pmI'm not sure, but the T-Bill data looks like it's yield based, and not the actual monthly fluctuations of the securitized traded t-bill product.D1984 wrote: ↑Tue Apr 13, 2021 9:13 pm
Meanwhile, here is the T-Bill TR data monthly for 1939, 1940, and 1941 (I tried to PM it to you but for some reason the PM didn't appear in my outbox or sent messages so I don't know if it got sent or not).
https://filebin.net/s6k1cnopgpps7qf7
I don't know where you (or I or anyone) can find T-Bill price going that far back. The Fed has a PDF archive of the monthly Bank & Quotation Record magazine from the early 1900s to the early 1960s but all of the 1938, 1939, 1940, 1941, 1942, or any of the rest of the 1940s editions (they came out monthly on the first week of every month; quoted prices and yields were from the last trading day or the prior month) of it don't quote T-Bills by price; they give money market rates and T-Bill rates but no price on the bills themselves. The shortest-term Treasury paper they quote is typically whatever T-Note happens to be maturing most recently to the data the issue was published; they quote these as a price (T-Notes matured at par so if the price was, say, 100.3 then said T-Note was trading at a tiny bit above par). I have no doubt the data they quote is accurate but it likely won't suffice as a substitute for T-bill prices for several reasons, namely:
A. Sometimes you only had Notes maturing in, say, June or July and then the next one only matured in December. This leaves either a huge hole in the data or else leaves you suddenly switching from what is essentially a 1-month T-Bill to what is almost a 6-month T-Bill.
B. Treasury Notes' interest payments were (IIRC) fully 100% tax exempt (at least for all issues prior to mid-1941) while T-Bill interest was (again IIRC) only partially tax-exempt; this means that Notes would trade at a higher price and lower yield than they would if they were fully or partially taxable and as such this doesn't give a true "apples to apples" comparison between two otherwise identical securities (say a true 13-week Bill and a two-year T-Note that only has 3 months left until maturity).
I have not checked the Wall Street Journal issues from that far back to see if they post actual T-Bill prices or not; my local university library has every WSJ issue in digital format going all the way back to the 1920s. One I get my second COVID vaccine (I got the first shot a little less than a week ago; the Pfizer one at a local drugstore) and wait about two weeks after that one for my immunity to fully ramp up I can go to said library and research to see what I can find regarding whether or not the WSJ in 1940 or 1941 listed T-Bill prices in its section on Treasury securities.
Barring that, it looks like we may have to (to paraphrase former SecDef Donald Rumsfeld) "go to backtesting with the data we have....not the data we wish we had".
-
StrategyDriven
- Senior Member
- Posts: 135
- Joined: Thu Jul 09, 2020 5:58 pm
Re: Please meet Global Navigator and The Russell
Long term data status:
S&P 500, I have total return for S&P back to before 1950
VXUS, I have extended this us MSCI World ex USA, it isn't the best of fits to VXUS, but it's about all I can find out there, back to 1970
T-Bill, I have data back to 1969
Just need to get some actual or sim data for long term treasuries back to 1970 and I can then run Global Navigator back to 1970. If we can get LTT back, or even aggregate bond index going back, I can swap LTT from the aggregate bond returns.
Re: Please meet Global Navigator and The Russell
I've managed to obtain four different models for LTT total returns.StrategyDriven wrote: ↑Mon Apr 26, 2021 7:20 pm Long term data status:
S&P 500, I have total return for S&P back to before 1950
VXUS, I have extended this us MSCI World ex USA, it isn't the best of fits to VXUS, but it's about all I can find out there, back to 1970
T-Bill, I have data back to 1969
Just need to get some actual or sim data for long term treasuries back to 1970 and I can then run Global Navigator back to 1970. If we can get LTT back, or even aggregate bond index going back, I can swap LTT from the aggregate bond returns.
The first is using a 20-30 year model for LTTs; this is similar to but not identical the ICE U.S. Treasury 20+ Year Bond Index used by the vanilla ETF TLT and the leveraged ETF TMF (IIRC the indexes behind those exchange-traded funds actually are for many different bonds in that maturity range while this fund just simulates a simple 20-30 ladder and its capital gains/losses and income returns each month).
The second is using a similar model to the standard Bloomberg-Barclays Long Government/Long Treasury used by VLGSX (and is actually pretty similar in returns to VUSTX or VUSUX despite those being active funds and not index funds).
Both these go back to the early or mid-1950s (actually the first one goes back to the early 1870s but it doesn't really try to give true monthly returns that far back; it just takes the annual return and divides it roughly by 12.....the actual real true monthly returns start around late 1952 or early 1953; the returns for the second one start at January 1955).
Both these models use real prices and interest rates (albeit with interpolated rates where no yield for a particular maturity was available) from LTTs from the actual time periods as far back as the model/s go.
The third is for an actual as close as possible simulation of the ICE U.S. Treasury 20+ Year Bond Index; this was originally done to simulate TMF (an underlying "vanilla" non-leveraged index was needed to simulate a leveraged product; this was the index that was chosen to simulate since it is indeed the index underlying TMF). It goes back to 1955 as well.
The fourth and final one is just the Ibbotson 20-year Treasury TR (i.e. Ibbotson long-term government index TR from SBBI) back to the end of 1925; this is just assuming a 20-year maturity bond rolled over monthly (i.e. you buy a 20-year Treasury Bond at the first of one month--or the very end of the very last trading day of the preceding month--and the at the end of THAT month you sell it as a now 19 year and 11 month Treasury and buy another 20-year Treasury and so ad infinitum; the total monthly returns are the income and capital gain/loss produced by doing this each month).
Actually, I have another one as well. It is from Ryan ALM and is their long-term Treasury index TR daily back to early 1973; it only goes forward to mid-2003 but by that point we have plenty of "real" LTT returns from VUSTX and TLT anyway. I also have this one monthly if needed. Note that this index is actually based on prices and yields taken daily from actual Treasury primary and secondary auctions/sales
Finally, since some of your models do switch into EDV (i.e. long-term long-duration zero coupon Treasury STRIPS) and/or EDV I have for TMF a simulation back to 1955 (based on the abovementioned index leveraged at appropriate financing rates i.e. LIBOR back to 1986 and then before LIBOR the T-bill rate +0.38% annually....in both cases dividend by as many trading days as there were in the year). For EDV I have actual daily/monthly TR data as follows:
For EDV:
From late 2007 to present - EDV itself
From 8-31-2006 to late 2007 - PEDIX
From 2-28-1996 to 8-31-2006 - BTTRX (note that I also have the Ryan ALM 25-Year Treasury STRIPS TR Index monthly from 3-31-85 to year-end 2012 if you don't want to use BTTRX for the post 2000 or 2001 period by which time it would have had 25 years or less until maturity and thus wouldn't be as truly long-duration as PEDIX or EDV would've been)
BTTTX from 12-29-1989 to 2-28-1996
BTFTX from 9-30-1986 to 12-29-1989
For 1-1-86 to 9-30-86 I have a monthly return series derived from roughly 27 to 29.5 years remaining Treasury STRIP returns. We could also just use the Ryan ALM 25 Year Treasury STRIP indexes for this period as they go back to early 1985 but the longest maturity of these until the mid-2000s was 25 years whereas all the other indexes/fund here were for anything from 25+ to 30 year zeroes.
If you want to go back any further than that I do have simulated zero coupon Treasury yields monthly (albeit not returns....you'd need to calculate those from the yields.....and you would need to use a different set of equations than the ones for coupon bearing bonds as zeroes are a different beast entirely) from Mccullogh and Shiller's paper on term structure of interest rates; they used a modified yield-spline methodology to calculate zero yields from coupon bearing bond yields; this series goes back to the late 1940s.
Give me a couple of days and I'll get these all uploaded.
PS - IIRC some of your models used QQQ, TQQQ, and UPRO as well. I can get UPRO/SPXL simulated data back to 1955 and QQQ and TQQQ back to the mid-70s if you wish. I'll also explain what data was used to simulate them. Do you wish me to upload those as well.
-
StrategyDriven
- Senior Member
- Posts: 135
- Joined: Thu Jul 09, 2020 5:58 pm
Re: Please meet Global Navigator and The Russell
Global Navigator is the only strategy that can be back tested way back, the others all use Russell Indexes which were not around that far back. Even for Global Navigator I can’t really find a great option for VXUS going back, the MSCI World ex-USA is as close as I can locate and that’s only back to 1970.
-
StrategyDriven
- Senior Member
- Posts: 135
- Joined: Thu Jul 09, 2020 5:58 pm
Re: Please meet Global Navigator and The Russell
I've got Global Navigator extended back to 1970, the only missing piece is Long Term Treasuries, I used 10 Year Treasuries from 1970 through May 1986 until the LTT can be found.
See this linked spreadsheet.

See this linked spreadsheet.
Re: Please meet Global Navigator and The Russell
Check your PMs and you might find you are not missing the LTT data anymore :-)StrategyDriven wrote: ↑Tue Apr 27, 2021 1:53 pm I've got Global Navigator extended back to 1970, the only missing piece is Long Term Treasuries, I used 10 Year Treasuries from 1970 through May 1986 until the LTT can be found.
See this linked spreadsheet.