Page 1 of 1
Re: Risk Parity and the Permanent Portfolio
Posted: Wed May 23, 2018 4:04 pm
by blue_ruin17
Kbg wrote: ↑Wed May 23, 2018 9:01 am
If anyone pays attention to ongoing academic research much of it is now pointing out how much of the previous stuff A) was garbage or B) was not garbage but now no longer outperforms.
Can you elaborate on this?
Re: Risk Parity and the Permanent Portfolio
Posted: Wed May 23, 2018 9:57 pm
by Kbg
I could but there is a a lot that could be said...a good place to start is Alpha Architect which posts a lot of academic summaries.
Re: Risk Parity and the Permanent Portfolio
Posted: Thu May 24, 2018 12:32 am
by boglerdude
Fama backpedals on small factor around 4min
https://www.youtube.com/watch?v=HIKO-t4vU6Q
And, once a money making strategy/factor is found, money piles in and it goes away. PEs for small value funds are higher than the market right now.
The real money is in insider trading and front running. (not legal advice)
Re: Risk Parity and the Permanent Portfolio
Posted: Thu May 24, 2018 6:27 am
by Hal
Tyler wrote: ↑Sun May 20, 2018 5:48 pm
1) Volatility Risk Parity: Mathematically balancing the effects of different assets in a portfolio by scaling each asset according to their volatility. A good example would be the All Seasons portfolio, Larry portfolio, and (even if he might not describe it the same way) Desert portfolio. Look at the AAs and you'll note the similarity of how they scale up fixed income percentages to balance the high risk assets.
That's an interesting observation. So would you, or other forum members, consider both the Desert Portfolio (10% Gold, 2:1 Bonds;Shares) and the Lemonade Permanent Portfolio
https://wiki.earlyretirementextreme.com ... 9_lemonade (25% Gold 2:1 Bonds:Shares) to be both Volatility Risk Parity Portfolios?
I wonder what issues just holding intermediate bonds would present?
Re: Risk Parity and the Permanent Portfolio
Posted: Thu May 24, 2018 9:34 am
by Tyler
Any time you look to categorize things there will be areas of overlap, and I certainly don't mean to over-simplify all of the thought that has gone into various portfolios. It's more about pointing out general categories to help differentiate between different types of asset allocation theories. It's also a lot more obvious when you look at the AAs side by side. I'm working on a presentation on this, and I'm sure I'll also turn it into a post sometime soon.
I agree with Pugchief's summary. Both the observation about the bullet vs. barbell and the general categorization.
Re: Risk Parity and the Permanent Portfolio
Posted: Thu May 24, 2018 12:52 pm
by Hal
Thanks for your comments Pugchief and Tyler,
I must admit it's undefined as to where an Economic Risk Parity model stops and a Volatility Risk Parity Model starts.
This table from Stable Investing is informative. Ryan had stated
Although the dollar weightings might appear to offer different exposures, the risk allocation across the portfolios is almost identical.
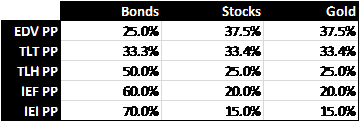
Taking the PP rule of 15% to 35% asset allocations (with cash & bonds combined) all but the EDV portfolio meets the PP requirements.
<edit> Actually, I think my above line is wrong. Only the TLH portfolio would pass - the other bonds durations don't match 50/50 Cash/LT bonds
Re: Risk Parity and the Permanent Portfolio
Posted: Sun Jun 03, 2018 2:41 am
by Smith1776
Another great Ray Dalio series of videos. This pretty much reiterates much of what has been discussed, but it is nonetheless a very interesting and entertaining series of shorts.
https://www.investopedia.com/video/play ... portfolio/
Re: Risk Parity and the Permanent Portfolio
Posted: Sun Jun 03, 2018 11:14 pm
by boglerdude
Dalio on economic history, is there a decent PDF to mp3 translator?
https://www.valuewalk.com/wp-content/up ... agings.pdf
Any other good podcasts on "cycles?" Im still not convinced the Fed isnt causing them.
Re: Risk Parity and the Permanent Portfolio
Posted: Tue Jul 03, 2018 10:27 am
by Jeffreyalan
So what is the harm in tweaking the PP to have more volatility parity? For example, to match volatilities over the past 10 years you would need:
25% Cash (SHV)
25% Gold (GLD)
25% LT Bonds (50% TLT 50% EDV)
25% Small Cap Stocks (SLY)
Making those tweaks gives you a CAGR of 7.23% vs 6.14% for the standard 4 ETF PP. A Sortino ratio of 1.92 vs 1.73 for the PP.
Thoughts?