The Desert Portfolio
Moderator: Global Moderator
Re: The Desert Portfolio
So it is basically a 30/70 with a slight gold hedge, which seems to lower the volatility even more. Not a bad portfolio, but returns over the next 40 years are likely to be quite a bit lower, even if bonds do not enter an outright bull market. Found this concerning 48-81: http://awealthofcommonsense.com/real-ri ... portfolio/ Seems like real returns of 30/70 would have been close to flat over that time period? The gold would of course make up for some of the lost ground if that scenario were to become reality again.
Re: The Desert Portfolio
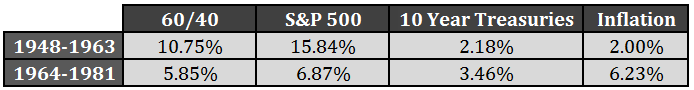
Yes, likely is the level of certainty we're at. If I knew for sure that bonds would tank, I'd be scrambling to set up my own hedge fundDesert wrote:That's a very good point, bringing up the 1948-1981 bond returns. Especially the 1964-1981 period shown in this chart:aeon wrote: So it is basically a 30/70 with a slight gold hedge, which seems to lower the volatility even more. Not a bad portfolio, but returns over the next 40 years are likely to be quite a bit lower, even if bonds do not enter an outright bull market. Found this concerning 48-81: http://awealthofcommonsense.com/real-ri ... portfolio/ Seems like real returns of 30/70 would have been close to flat over that time period? The gold would of course make up for some of the lost ground if that scenario were to become reality again.
[img width=500]http://awealthofcommonsense.com/wp-cont ... en-out.png[/img]
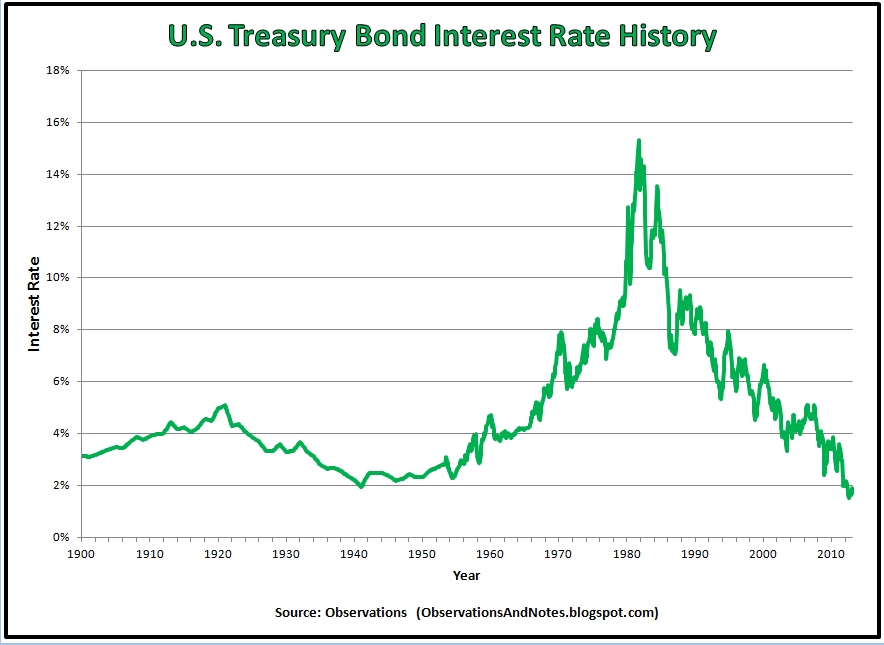
Obviously a bond-heavy portfolio is going to have a huge headwind in periods like that. And even the S&P 500 just barely beat the inflation rate. Gold would have helped in the late 70's. I haven't had a chance to find the data yet, but I suspect shorter treasuries and/or CD's would have outperformed 10 year treasuries in this period. With the rates rising rapidly in this period, shorter durations would, of course, have been preferable:
[img width=500]http://3.bp.blogspot.com/-Scat_VEIW9I/U ... istory.jpg[/img]
And even during the bond bull years, from 1980 to present, 10 year treasuries showed little advantage over 5 year. I'll look into this more.
But your point definitely stands: with bond yields at historic lows, and equity valuations high, future returns will likely be low.
I guess shorter maturities would hurt you in a depression era scenario though?
-
goodasgold
- Executive Member

- Posts: 387
- Joined: Tue Jan 01, 2013 8:19 pm
Re: The Desert Portfolio
Amen, brother. I stay away from BND like the plague, with its large amounts of mortgage backed securities just waiting to be slaughtered. It seems like the lesson of 2008 hasn't been learned yet.Desert wrote:aeon wrote:Regarding depression scenarios, it appears to me that the most important factor is holding treasuries, and not corporate, MBS and other FI typically not valued highly in a flight to safety. This is why I really dislike the Total Bond Market fund, which is nearly sacred to most Bogleheads.Desert wrote: But your point definitely stands: with bond yields at historic lows, and equity valuations high, future returns will likely be low.
In my VP I hold a substantial amount of VBILX, which does not include MBS.

Re: The Desert Portfolio
The 5 year Treasury yield is 1.59% as of Friday
A 5 year CD at Ally Bank yields 2.00%
Capital One 360 is 2.25%
A 5 year CD at Ally Bank yields 2.00%
Capital One 360 is 2.25%
Re: The Desert Portfolio
So, at http://portfoliocharts.com/portfolio/hurricane/
I tested the Desert with 10 year Treasuries, and the Desert with Total Bond allocation. I actually liked it with the Total Bond allocation better. The worst-case 30 year 4% SWR end value was $709k, not $468k. The median case was $1834k, not $1772k. The high case, though, was lower at $2675k vs $3331k.
This seemed counter-intuitive...with the less safe (from a default risk standpoint) Total Bond mix, I get safer 30 year SWR performance. Maybe the big risk isn't default risk, but interest rate risk.
Then, on another try, I used 30% Long Treas and 30% Short Treas, and that worked as good as Total Bond in the Desert. It turns it into a gold-light HBPP.
Last edited by ochotona on Fri Aug 14, 2015 11:08 pm, edited 1 time in total.
-
mathjak107

- Executive Member
- Posts: 4456
- Joined: Fri Jun 19, 2015 2:54 am
- Location: bayside queens ny
- Contact:
Re: The Desert Portfolio
the longer term 10 year treasuries had less default risk but since it never came in to play the shorter term total bond fund did better .
that is just what was found when bill bengan the grand pappy of safe-max was trying to find a safe withdrawal rate. bill had less failures using 5 year gov't bonds then the longer 10 year corporate bonds used in the trinity study . it seems that more volatility in an asset can be a double edge sword as to how it performs within the portfolio too.
researchers then took it a step further . instead of going back to 1926 which is when the trinity study's data starts they went back 146 years using shillers data and substituting the shorter term bonds again they found the out comes held true.
periods of rising rates like the 1966 group saw caused failure .
that is what scares me about holding longer term bonds at this point in my retirement portfolio . while rates may not go up today , eventually in the near term they are very likely to and those retiring today may be in a similar rising rate scenario . .
" as dr pfau found
While Mr. Bengen’s original research combined the S&P 500 index with five-year intermediate term government bond returns, the Trinity Study used long-term high-grade corporate bond returns instead. The different choice for bonds explains why the worst-case scenario for Mr. Bengen (his SAFEMAX) was a withdrawal rate of 4.15 percent, while the original Trinity Study found that a 4 percent withdrawal rate only had a 95 percent success rate. With more volatile corporate bonds, the sustainable withdrawal rate dipped slightly below 4 percent in 1965 and 1966. This led people to hear that the 4 percent rule has a 95 percent chance for success, though that is only the historical data, and it does not imply that today’s retirees will enjoy the same odds for success. Nonetheless, a 95 percent chance for success has a special meaning in statistics about providing a good level of confidence, so it was easy to misunderstand this point.
bill bengen had this to say
Bengen: I don’t know. I think it may be necessary to make changes in this environment from what perhaps the portfolio would have had 30 years ago, because obviously, after a 30-year bull market in bonds, we’re at a much different place than we were in the early 80s with respect to bonds. Remember, stocks, relatively speaking to bonds, offer much better returns going forward. I’m in favor of taking a more dynamic view of things, and I think the greater risk is sticking to a fixed asset allocation in this environment, rather than changing it.
very good round table with bengen , pfau , guyton and kitces in the journal of financial planning on this subject . they are likely 4 of the top retirement researchers in the industry . .
http://www.onefpa.org/journal/Pages/Saf ... 0Know.aspx
Last edited by mathjak107 on Sat Aug 15, 2015 7:09 am, edited 1 time in total.
Re: The Desert Portfolio
I'm not certain that (bond portfolio effective duration) = W1 * D1 + W2 * D2 + W3 * D3 + ... where W are weights, D are durations. I use this calculation all the time, but I'm not sure it's correct.Desert wrote: Yeah, there is something going on with this analysis that I don't fully understand yet. I looked at the following cases:
1. 5YT instead of 10. This case performed just a bit better than the TBM case, which makes sense given the similar average duration, but without default risk.
2. 48% 5YT, 12% LTT. This case should have performed very much like the 10YT case, given nearly identical maturity. It doesn't.
3. 30% LTT, 30% STT. This mix has a longer maturity than 10YT, yet performed more like the 5YT than the 10YT.
I'm not sure the 10YT data used here makes sense to me yet. I think there might be a data problem. Meanwhile, I'll continue using 48% 5YT and 12% LTT as a proxy for 10YT, as I've done in Simba's spreadsheet.
Also tried portfoliovisualizer.com, and the 5 year Treas beats 10 year there. Total Bond does OK. They're all roughly the same.
Re: The Desert Portfolio
I have been looking at Emerging Market mutual funds and ETFs, and think they all stink. Most of them haven't gone anywhere since the first Greek debacle in 2011. Now China is a big part of the EM indices, so if you want to get EM now and in the future, you need to wait for China to correct. If the EM market goes down significantly from where it is today, I'd by happy to buy a little slice. Right now I have 0%.Desert wrote: Now, if you feel like it, take a look at slicing the equity three ways, 10% Emerging Markets, 10% Small Cap Value, 10% Total Stock Market. I'd be interested in your views on that mix.
Look the the "VWO" ETF, which goes back to March 2005. Starting a comparison with the SP500 or Dow from the market bottom in 2009, VWO does great, then stalls May 2012, and then has been going sideways for more than three years (I would be using SCHE, it tracks VWO very well, and it trades free from Schwab).
Now the merging economies are getting crushed because their dollar demoninated debt has gone up ten-fold in the last decade. And VWO is suffering because of the strong dollar (results translated to US Dollar appear weaker). And China's stock market has gone into spasm. Brazil is rocked by the Petrobras scandal. Russia is considered Emerging Europe. It seems possible the the Dollar might strengthen further, if we raise interests while others are not.
So, I'll take a breather on Emerging. This is the proverbial "falling knife". When it pops it's little head above the 60-day moving average, I'm supposed to get an email. I will take a look at that time.
As far as small caps, mid caps USA, I have them in my US broad market ETF, which is SCHB, similar to VTI. I slavishly follow Schwab's 75% USA to 25% International split of stocks for my risk tolerance level, have been using if for decades, see no reason to quit now. This also comports pretty well with Craig Rowland's advice to maybe hold 20% of one's HBPP holding in non-USA stocks if you a USA person (page 82 of The Permanent Portfolio).
Last edited by ochotona on Sat Aug 15, 2015 11:36 am, edited 1 time in total.

Re: The Desert Portfolio
I went back and checked the source data and I don't see any mistakes. A few notes on the data:Desert wrote: Yeah, there is something going on with this analysis that I don't fully understand yet. I looked at the following cases:
1. 5YT instead of 10. This case performed just a bit better than the TBM case, which makes sense given the similar average duration, but without default risk.
2. 48% 5YT, 12% LTT. This case should have performed very much like the 10YT case, given nearly identical maturity. It doesn't.
3. 30% LTT, 30% STT. This mix has a longer maturity than 10YT, yet performed more like the 5YT than the 10YT.
I'm not sure the 10YT data used here makes sense to me yet. I think there might be a data problem. Meanwhile, I'll continue using 48% 5YT and 12% LTT as a proxy for 10YT, as I've done in Simba's spreadsheet.
1) 10-year treasuries are the one data set not taken from Simba's spreadsheet. They're from Professor Aswath Damodaran's Data Library (Download Data). It's calculated from FRED data and seems legit, but as with any new data source there may be differences in assumptions. Let me know if you spot one I've missed.
2) Note that all of the data on Simba's spreadsheet accounts for an expense ratio. They track Vanguard funds where the annual return accounts for the ER, and when splicing old data sets to newer index funds, they deduct the modern ER from the old data to make it consistent. Knowing this, while raw 10-year treasuries have no ER, I deducted a 0.20% fee each year from the source data to make it a fair comparison with everything else. Except for that one adjustment, all data should be the same as you see at Portfolio Visualizer as we use the same open sources.
3) The 5-year treasuries are labeled separate places as "5-year" and "intermediate" on Simba's SS. Most precisely, they track VFITX -- an intermediate treasury fund with an average maturity of 5.9 years. Likewise, Long Term Treasuries are VUSTX with an average maturity of 25.1 years. Keep that in mind when blending data.
If you see any errors in the data or my logic, please let me know!
-------
Regarding the math of bullets vs. barbells, I'm no expert but here are a few theories:
1) Remember that the calculator assumes that you rebalance once a year. I imagine that holding a bond barbell may not always exactly match a bullet when the yield curve changes shape throughout the year and you're rebalancing annually and not continuously.
2) Yield curves aren't linear. So you can't accurately interpolate returns in the middle by drawing a straight line between points on the two ends. Sometimes it may be close, but there will always be some error involved.
Strangely mesmerizing example: http://www.businessinsider.com/us-treas ... 14-2014-12
Last edited by Tyler on Sat Aug 15, 2015 4:26 pm, edited 1 time in total.
Re: The Desert Portfolio
barrett,
I see no material risk in changing the weightings between the four PP components in order to achieve a higher return. In fact, starting this year, I have attempted the same thing.
Instead of using the strict 4 x 25% weightings, I am using weightings based upon the formula (x /y) / y, or (x/y^2). "x" is the price of the component today and "y" is the price 63 trading days ago. I update my allocation at the end of every quarter. Based upon a 10 year backtest, the average annual return using this approach is about 2% higher than the traditional 4 x 25%, with very slightly higher volatility.
If you are comfortable with the desert allocation, then go for it.
Re: The Desert Portfolio
Is the backtest published anywhere?EdwardjK wrote: barrett,
I see no material risk in changing the weightings between the four PP components in order to achieve a higher return. In fact, starting this year, I have attempted the same thing.
Instead of using the strict 4 x 25% weightings, I am using weightings based upon the formula (x /y) / y, or (x/y^2). "x" is the price of the component today and "y" is the price 63 trading days ago. I update my allocation at the end of every quarter. Based upon a 10 year backtest, the average annual return using this approach is about 2% higher than the traditional 4 x 25%, with very slightly higher volatility.
If you are comfortable with the desert allocation, then go for it.
Re: The Desert Portfolio
ochotona,
Sorry, I should have explained that better.
For the four assets, I take the adjusted closing price at the end of the quarter divided by the adjusted closing price 63-trading days ago, and then again divided by the adjusted closing price 63-trading days ago (x /y / y). This results in four fractions. I then take each fraction and divide by the sum total of the four fractions. This then provides the allocation percentage for each asset that totals to 100%.
I update the allocation at the end of each quarter.
I have posted this in another topic on this board. Another commentator pointed out this works "only" because the individual asset prices are fairly close together. But it did solve my dilemma where using the traditional x/y to determine the period-over-period return sometime resulted in a negative number. I could not figure out how to allocate between assets using positive and negative returns. The x / y / y always results in a positive number, so problem solved.
I do not have a proof that the calculation is valid, other than a 10-year backtest that resulted in a 2% higher average annual return compared to the traditional 4 x 25% allocation. Maybe a commentator smarter than I can prove or disprove it.
Re: The Desert Portfolio
Hey Edward,
Two questions...
Do you use 63 trading days because there are roughly that many in a quarter?
Also, what is your current asset allocation using the x/y/y formula?
Thanks.
Two questions...
Do you use 63 trading days because there are roughly that many in a quarter?
Also, what is your current asset allocation using the x/y/y formula?
Thanks.
Re: The Desert Portfolio
barrett,
Hi. I use 63-trading days because there is literature that 63-days is a good measure of current trend/momentum. As of June 30, 2015, my allocation is:
VTI - 26%
TLT - 19%
GLD - 23%
SHY - 32%
If I updated it today, the allocation would be:
VTI - 24%
TLT - 24%
GLD - 21%
SHY - 31%
Hi. I use 63-trading days because there is literature that 63-days is a good measure of current trend/momentum. As of June 30, 2015, my allocation is:
VTI - 26%
TLT - 19%
GLD - 23%
SHY - 32%
If I updated it today, the allocation would be:
VTI - 24%
TLT - 24%
GLD - 21%
SHY - 31%
Re: The Desert Portfolio
You could get over the asset per unit price influencing the weight if you used the ratio of beginning and end prices.
So if the asset is $50 at the beginning, and $55 at the end, you have a ratio 55/50 = 1.1. It would remove the asset price totally from the calculation. If the asset were $25 and ended at $27.50, you'd still get 1.1.
The question is, what kind of behavior do you want that 1.1 to correspond to? Do you want to use 1.1 itself as a relative weight, or square it, or cube it, or multiply it by a constant, or take the "e" exponent? Then after you do those operations on the individual assets, you'd form them into weights adding to 100%.
Those would be cool backtests, actually.
Last edited by ochotona on Sun Aug 16, 2015 7:43 am, edited 1 time in total.
-
dualstow

- Executive Member
- Posts: 14306
- Joined: Wed Oct 27, 2010 10:18 am
- Location: synagogue of Satan
- Contact:
Re: The Desert Portfolio
A potentially novice question: why does the Desert Portfolio have such a long drawdown when it has such a small allocation to stocks?
This morning, I was looking at three portfolios: the pp, Larry's min fat tails, and Desert.
At Tyler's portfolio charts, we see the longest drawdowns for those are 2 years, 5 years, and 10 years respectively.
The worst year for Desert is a nice small -10% and I still find the DeP attractive, but why the protracted drawdown?
Re: The Desert Portfolio
For what time period do you see that long drawdown? When I run it on Peaktotrough for the 1975 to 2015 period, I really only see 1981 and 1994 as negative years. 1977 and 2001 (and 2015 so far) are also in the red but with losses that are virtually zero. For the bond portion I am just using 10-year treasuries, which is just my own simplification but close enough I think.dualstow wrote: A potentially novice question: why does the Desert Portfolio have such a long drawdown when it has such a small allocation to stocks?
This morning, I was looking at three portfolios: the pp, Larry's min fat tails, and Desert.
At Tyler's portfolio charts, we see the longest drawdowns for those are 2 years, 5 years, and 10 years respectively.
The worst year for Desert is a nice small -10% and I still find the DeP attractive, but why the protracted drawdown?
-
Pointedstick

- Executive Member
- Posts: 8866
- Joined: Tue Apr 17, 2012 9:21 pm
- Contact:
Re: The Desert Portfolio
It looks like 10-year treasuries didn't have a good run in the 70s. Also, TSM underperformed sliced-and-diced stock allocations during that time. Try swapping the 30% TSM out for for 10% each in large, medium, and small value stocks and see the difference. Also try turning the bullet bond allocation into a barbell. That helps a bit too.
Human behavior is economic behavior. The particulars may vary, but competition for limited resources remains a constant.
- CEO Nwabudike Morgan
- CEO Nwabudike Morgan
-
dualstow
- Executive Member
- Posts: 14306
- Joined: Wed Oct 27, 2010 10:18 am
- Location: synagogue of Satan
- Contact:
Re: The Desert Portfolio
Will do, PS, thank you!
http://portfoliocharts.com/portfolio/desert-portfolio/
I don't know, but it's in Tyler's chart at the right. Says, "10 yrs, Longest drawdown."barrett wrote: For what time period do you see that long drawdown?
http://portfoliocharts.com/portfolio/desert-portfolio/
Last edited by dualstow on Sun Sep 06, 2015 11:07 am, edited 1 time in total.
Re: The Desert Portfolio
Yeah, I see it there on the chart for the ten years starting in 1972. It's due to the crappy performance of stocks and bonds in the 1970s (big generalization, I realize). The lower gold allocation wasn't enough to pull them up into positive territory.dualstow wrote: Will do, PS, thank you!
I don't know, but it's in Tyler's chart at the right. Says, "10 yrs, Longest drawdown."barrett wrote: For what time period do you see that long drawdown?
http://portfoliocharts.com/portfolio/desert-portfolio/
-
dualstow
- Executive Member
- Posts: 14306
- Joined: Wed Oct 27, 2010 10:18 am
- Location: synagogue of Satan
- Contact:
Re: The Desert Portfolio
Yeah, that's it. Top line.barrett wrote: Yeah, I see it there on the chart for the ten years starting in 1972. It's due to the crappy performance of stocks and bonds in the 1970s (big generalization, I realize).
But the other portfolio mentioned in my question is Larry Swedroe's, and it has no gold. Maybe TIPS {hypothetically would have} worked back then?The lower gold allocation wasn't enough to pull them up into positive territory.
Re: The Desert Portfolio
I don't know Swedroe's stuff but a quick glance shows 40% short-term bonds. That would be more or less like holding a lot of cash and cash had huge nominal returns in some of those years. In the summer of 1981 I was briefly getting 16% or so on a money market fund. A strong return in 40% of a portfolio is usually enough to avoid a losing streak. Hope that helps.dualstow wrote: But the other portfolio mentioned in my question is Larry Swedroe's, and it has no gold. Maybe TIPS {hypothetically would have} worked back then?
Re: The Desert Portfolio
Dualstow, Hope I am not getting in the way in your search for truth! I just wanted to suggest having a look at the return of a portfolio that was 100% in one-year T-Bills from 1/1/72 to 1/1/82. That "portfolio" had a a CAGR of 7.78 and was especially juicy the last three years. This is all in nominal terms, of course, but with the choppy stock market of the 1970s (some years were terrific, others horrible), it would have been very helpful to be able to park some of your stock winners in a cash fund that was cranking out solid gains.
I will now crawl back into my hole.
I will now crawl back into my hole.
Last edited by barrett on Sun Sep 06, 2015 1:43 pm, edited 1 time in total.
-
dualstow
- Executive Member
- Posts: 14306
- Joined: Wed Oct 27, 2010 10:18 am
- Location: synagogue of Satan
- Contact:
Re: The Desert Portfolio
Not at all; you're very helpful.
-
dualstow
- Executive Member
- Posts: 14306
- Joined: Wed Oct 27, 2010 10:18 am
- Location: synagogue of Satan
- Contact:
Re: The Desert Portfolio
But, are you using a different tool than Tyler's? Whether I focus on short-term treasuries or the treasury money market (there is no T-Bill choice) I still get plenty of red in the 1970s.