Tyler, your charts really show how big a difference start date makes in portfolio performance. Using annual start dates it only takes 3 years before all portfolios show a real return, while PH's monthly start dates take 10 years. That's a pretty big variance. Daily start dates would probably carry it out even farther.Tyler wrote: Love that last line chart, Pet Hog. Here's another way to look at it. (Basically graphing the bottom bar on your main chart, but using my annual data)
Worst 3 year PP performance ever?
Moderator: Global Moderator
Re: Worst 3 year PP performance ever?

Re: Worst 3 year PP performance ever?
One should not necessarily assume that all of the variation is due to start date. The more granular the analysis, the more likely you are to find all kinds of outliers. For example, something like the flash crash ten years in could create a snapshot of a long-term loss for one month that doesn't tell the whole story.iwealth wrote: Tyler, your charts really show how big a difference start date makes in portfolio performance. Using annual start dates it only takes 3 years before all portfolios show a real return, while PH's monthly start dates take 10 years. That's a pretty big variance. Daily start dates would probably carry it out even farther.
Next, remember that everything is relative. I expect that a similar chart for stocks would show negate periods more than 20 years out.
Finally, remember that there's rarely a single start date. Most people don't invest their life savings on day one -- they invest lots of smaller periodic contributions. That would change the analysis considerably.
Basically, always be careful about reading too much into any one chart. Real life usually isn't so organized.
Last edited by Tyler on Fri Jun 26, 2015 8:30 pm, edited 1 time in total.


Re: Worst 3 year PP performance ever?
I don't recall exactly what we said in the book, but I have always thought that for most new PPers it made sense to ease into the strategy slowly, not necessarily with the goal of timing the markets, but just to gradually acclimate yourself to the strategy and to make sure they you don't have the bad luck of starting your portfolio at the worst possible time.
The thing is, the worst possible time usually looks like a great time because it often comes after the portfolio has experienced above average returns and everyone is talking about it.
The best time to start a new PP is probably when everyone hates the strategy and thinks that it has finally stopped working, but no one wants to do it then.
I will never forget how in the first half of 2008 EVERYONE was saying that the worst possible investment was 30 year treasuries, and that the secular bull market in treasuries was over because gold was clearly indicating that higher inflation and higher interest rates were on the horizon. There simply wasn't a more obvious play than to either stay away from long dated treasuries, or if you were REALLY smart you could just short them and make some easy money. That didn't work out very well:
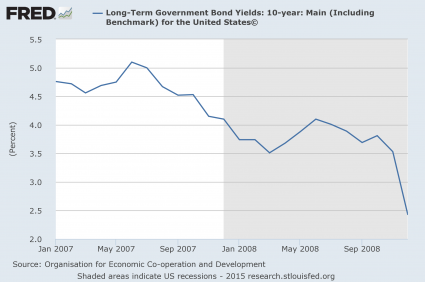
At that time I was still trying to completely wrap my mind around the PP concept, and everyone I talked to about it said that ANY strategy that called for 25% of the portfolio to be held in 30 year treasuries was a dumb strategy and that's why they would never seriously consider using it. Those conversations really opened my eyes to how little anyone really knows about what the markets are going to do next.
In retrospect, mid-2008 would have been a GREAT time to start a new PP because the PP maintained its value when everything else was getting wiped out in the second half of the year, and then it saw returns above the historical mean in 2009, 2010, and 2011.
The thing is, the worst possible time usually looks like a great time because it often comes after the portfolio has experienced above average returns and everyone is talking about it.
The best time to start a new PP is probably when everyone hates the strategy and thinks that it has finally stopped working, but no one wants to do it then.
I will never forget how in the first half of 2008 EVERYONE was saying that the worst possible investment was 30 year treasuries, and that the secular bull market in treasuries was over because gold was clearly indicating that higher inflation and higher interest rates were on the horizon. There simply wasn't a more obvious play than to either stay away from long dated treasuries, or if you were REALLY smart you could just short them and make some easy money. That didn't work out very well:
At that time I was still trying to completely wrap my mind around the PP concept, and everyone I talked to about it said that ANY strategy that called for 25% of the portfolio to be held in 30 year treasuries was a dumb strategy and that's why they would never seriously consider using it. Those conversations really opened my eyes to how little anyone really knows about what the markets are going to do next.
In retrospect, mid-2008 would have been a GREAT time to start a new PP because the PP maintained its value when everything else was getting wiped out in the second half of the year, and then it saw returns above the historical mean in 2009, 2010, and 2011.
Q: “Do you have funny shaped balloons?”
A: “Not unless round is funny.”
A: “Not unless round is funny.”
Re: Worst 3 year PP performance ever?
This is true. So not just start dates, but also end dates.Tyler wrote: One should not necessarily assume that all of the variation is due to start date. The more granular the analysis, the more likely you are to find all kinds of outliers. For example, something like the flash crash ten years in could create a snapshot of a long-term loss for one month that doesn't tell the whole story.
Next, remember that everything is relative. I expect that a similar chart for stocks would show negate periods more than 20 years out.
No doubt. I hope my post didn't come off as a negative jab against the PP. I was just intrigued by the data. Start date portfolio performance variation has always been an interest of mine. I think it gets overlooked. Statistically dollar-cost averaging underperforms lump sum investing and I've always believed that to be the way to go. But I'm starting to change my tune a bit. You don't want to end up being that negative outlier.
Re: Worst 3 year PP performance ever?
And don't underestimate people's psychological need to gradually ease into something as unusual as the PP.iwealth wrote: No doubt. I hope my post didn't come off as a negative jab against the PP. I was just intrigued by the data. Start date portfolio performance variation has always been an interest of mine. I think it gets overlooked. Statistically dollar-cost averaging underperforms lump sum investing and I've always believed that to be the way to go. But I'm starting to change my tune a bit. You don't want to end up being that negative outlier.
In reading rookie posts here, a common theme is: "I invested everything I've got in the PP six months ago and it's down 3%! This isn't what I signed up for. I'm going to look for something safer."
I think that if you ease into it and it goes down you can feel good about dollar cost averaging as you build your position, and if it goes up you can congratulate yourself on choosing a good strategy as you build your position. I think that this approach is consistent with the way a lot of people actually think.
I would rather see a new PP investor leave a few percentage points of gain on the table when he started out if it meant that he was able to stick with the strategy over the longer term because he didn't experience early trauma with it.
Q: “Do you have funny shaped balloons?”
A: “Not unless round is funny.”
A: “Not unless round is funny.”
Re: Worst 3 year PP performance ever?
Here you go, iwealth! Good suggestion. I added black and blue colors to the chart for the highest real CAGRs, and used the three shades of green for what used to be the 3-6% band. A lot more detail has emerged.iwealth wrote: Pet Hog, not sure if you'd be willing to make a modification, but it strikes me there's a little room for more granularity in the color coding. Since the 3-6% average return range makes up such a vast majority of the data, it would be interesting to see that broken down perhaps into two subsets like 3-4.5% and 4.5%-6% or even a 3-4, 4-5, 5-6%. After 30 years, it looks like the max return was 5.8% vs. a minimum of 3.6%. That's a pretty tight range, but it's still fairly large when one starts to consider safe withdrawal rates and such.
[img width=600]http://i.imgur.com/HjSCtIf.jpg[/img]
As an aside, I chose the colors originally to copy Tyler's charts. He had mentioned somewhere that Excel allows "conditional formatting," which was news to me, and it wasn't too difficult to use it to color most of the cells in my old chart. Unfortunately, my version of Excel allows only three conditional formats (I used them here for the three green cells), so adding these new colors in was quite tedious. I hope I haven't made any mistakes. There were a lot of cells to check!
Re: Worst 3 year PP performance ever?
That chart is amazing.
Wow.
Wow.
Q: “Do you have funny shaped balloons?”
A: “Not unless round is funny.”
A: “Not unless round is funny.”
-
mathjak107

- Executive Member

- Posts: 4456
- Joined: Fri Jun 19, 2015 2:54 am
- Location: bayside queens ny
- Contact:
Re: Worst 3 year PP performance ever?
it is always the fact the best of outlooks end up having either the worst performance or all the biggest drops come from those times things couldn't look better.MediumTex wrote: I don't recall exactly what we said in the book, but I have always thought that for most new PPers it made sense to ease into the strategy slowly, not necessarily with the goal of timing the markets, but just to gradually acclimate yourself to the strategy and to make sure they you don't have the bad luck of starting your portfolio at the worst possible time.
The thing is, the worst possible time usually looks like a great time because it often comes after the portfolio has experienced above average returns and everyone is talking about it.
The best time to start a new PP is probably when everyone hates the strategy and thinks that it has finally stopped working, but no one wants to do it then.
I will never forget how in the first half of 2008 EVERYONE was saying that the worst possible investment was 30 year treasuries, and that the secular bull market in treasuries was over because gold was clearly indicating that higher inflation and higher interest rates were on the horizon. There simply wasn't a more obvious play than to either stay away from long dated treasuries, or if you were REALLY smart you could just short them and make some easy money. That didn't work out very well:
At that time I was still trying to completely wrap my mind around the PP concept, and everyone I talked to about it said that ANY strategy that called for 25% of the portfolio to be held in 30 year treasuries was a dumb strategy and that's why they would never seriously consider using it. Those conversations really opened my eyes to how little anyone really knows about what the markets are going to do next.
In retrospect, mid-2008 would have been a GREAT time to start a new PP because the PP maintained its value when everything else was getting wiped out in the second half of the year, and then it saw returns above the historical mean in 2009, 2010, and 2011.
all the best market times come from the worst outlooks . they come from the depths of stock market hell when the word equities makes you want to vomit.
Re: Worst 3 year PP performance ever?
Awesome, thanks PH. Can't believe you did so much of that manually. That chart should be a permanent fixture somewhere on this forum. Would hate to see it get buried someday.
Last edited by iwealth on Sat Jun 27, 2015 8:30 am, edited 1 time in total.
Re: Worst 3 year PP performance ever?
Wow. Now that's dedication!Pet Hog wrote: As an aside, I chose the colors originally to copy Tyler's charts. He had mentioned somewhere that Excel allows "conditional formatting," which was news to me, and it wasn't too difficult to use it to color most of the cells in my old chart. Unfortunately, my version of Excel allows only three conditional formats (I used them here for the three green cells), so adding these new colors in was quite tedious. I hope I haven't made any mistakes. There were a lot of cells to check!
Re: Worst 3 year PP performance ever?
I started a new post for PP charts and put a sticky on it.iwealth wrote: Awesome, thanks PH. Can't believe you did so much of that manually. That chart should be a permanent fixture somewhere on this forum. Would hate to see it get buried someday.
Please repost your best work there.
Thanks!
Q: “Do you have funny shaped balloons?”
A: “Not unless round is funny.”
A: “Not unless round is funny.”
-
bedraggled
- Executive Member
- Posts: 705
- Joined: Sat Sep 13, 2014 4:20 am
Re: Worst 3 year PP performance ever?
Pet Hog and Tyler,
For the Variable Portfolio folks, and for instructive comparison fueling the debate over cash, is it possible to construct these charts for the 3x33 portfolio?
Thanks.
For the Variable Portfolio folks, and for instructive comparison fueling the debate over cash, is it possible to construct these charts for the 3x33 portfolio?
Thanks.
-
MachineGhost

- Executive Member
- Posts: 10054
- Joined: Sat Nov 12, 2011 9:31 am
Re: Worst 3 year PP performance ever?
SupercaliFRACTilisticexpialidocious!Pet Hog wrote: Here you go, iwealth! Good suggestion. I added black and blue colors to the chart for the highest real CAGRs, and used the three shades of green for what used to be the 3-6% band. A lot more detail has emerged.
"All generous minds have a horror of what are commonly called 'Facts'. They are the brute beasts of the intellectual domain." -- Thomas Hobbes
Disclaimer: I am not a broker, dealer, investment advisor, physician, theologian or prophet. I should not be considered as legally permitted to render such advice!
Disclaimer: I am not a broker, dealer, investment advisor, physician, theologian or prophet. I should not be considered as legally permitted to render such advice!
Re: Worst 3 year PP performance ever?
About what you'd expect -- similar performance overall but with higher highs & lower lows.bedraggled wrote: For the Variable Portfolio folks, and for instructive comparison fueling the debate over cash, is it possible to construct these charts for the 3x33 portfolio?
[img width=300]http://s23.postimg.org/8yq50mhyj/PPnocash.jpg[/img]
-
bedraggled
- Executive Member
- Posts: 705
- Joined: Sat Sep 13, 2014 4:20 am
Re: Worst 3 year PP performance ever?
Tyler and Pet Hog,
You are magnificent! I suspect I asked a question about the 3x33 that you 2 already answered. I truly appreciate all the work you two, and all the others have done.
All the best,
Bedraggled
You are magnificent! I suspect I asked a question about the 3x33 that you 2 already answered. I truly appreciate all the work you two, and all the others have done.
All the best,
Bedraggled
Re: Worst 3 year PP performance ever?
Hi Tyler,
Appreciate your work. Can you clarify what this chart is showing? It looks like if you had invested in 1999, the real CAGR would have been negative for 7 years. This is inconsistent with your other charts and my own work.
Thanks.
Appreciate your work. Can you clarify what this chart is showing? It looks like if you had invested in 1999, the real CAGR would have been negative for 7 years. This is inconsistent with your other charts and my own work.
Thanks.
Tyler wrote: Here's another way to visualize the same data above.
[img width=600]http://i61.tinypic.com/156wzgo.jpg[/img]
Multi-year negative returns are rare but do happen. Note how consistent the compound results get after the first 5 years. Current short-term returns are nothing out of the ordinary.
-
lordmetroid

- Executive Member
- Posts: 200
- Joined: Wed Nov 26, 2014 3:53 pm
Re: Worst 3 year PP performance ever?
No you would not have been in the negative for 7 years. Light red is 0-3% increase.
Re: Worst 3 year PP performance ever?
Oh yeah, you're right. Thanks!
Tyler, way to throw me off by using red to represent a gain?
Tyler, way to throw me off by using red to represent a gain?
Re: Worst 3 year PP performance ever?
Yeah, this was an earlier version that used the same color scheme as the outside chart it was based on. I agree that the light red is confusing, and have since switched the color scale for most things.
-
vnatale

- Executive Member
- Posts: 9472
- Joined: Fri Apr 12, 2019 8:56 pm
- Location: Massachusetts
- Contact:
Re: Worst 3 year PP performance ever?
Great (to me) to read that much of your work was (still is?) Excel based?
It IS one of my all-time favorite software.
I have many times said that it there are at least two columns and two rows involved then I'm making an Excel worksheet.
Both personal and business life would be FAR more difficult if I was NOT able to use Excel!
But I still hold a grudge against Bill Gates for taking away AutoSave and replacing it with the nowhere as good Auto Recover. I'm guessing that AutoSave possibly caused too many problems for the less knowledgeable Excel users? But for the more knowledgeable Excel users AutoSave was far superior to Auto Recover in ALL ways!
Vinny
Above provided by: Vinny, who always says: "I only regret that I have but one lap to give to my cats." AND "I'm a more-is-more person."
-
vnatale
- Executive Member
- Posts: 9472
- Joined: Fri Apr 12, 2019 8:56 pm
- Location: Massachusetts
- Contact:
Re: Worst 3 year PP performance ever?
No exaggeration. I must have read at least a 100 times a variation of the bolded sentence above. However, this IS the first time I'm am pointing out the following to anyone.
Isn't that sentence (and all the equivalent ones I've read) somewhat misleading? For any basic analysis don't we need to look at the actual amount AND the percent change?
Example. I'm invested in a stock that is currently worth $100. One day it drops to $55. A 45% drop. As you point out it now needs to increase by almost 100% of the $45 to get back to the $100 starting point. But what should be so astounding about that? It is dropped by $45. Why are the probabilties any less that one day (even soon) it will increase by that same $45?
It somewhat alike (but, of course, not totally similar) to analyzing the pricing of a product.
It cost you $60 to make the product and you sell it for $100, for a $40 profit.
For that same $40 we have two vastly different percentages.
We can say that you've "marked up" your costs by 67% or we can say your gross profit margin is 40% (dividing the profit by the selling price). Same $40 but we have two dissimilar percentages associated with it, both being correct depending upon which denominator you chose to use.
Vinny
Above provided by: Vinny, who always says: "I only regret that I have but one lap to give to my cats." AND "I'm a more-is-more person."
-
vnatale
- Executive Member
- Posts: 9472
- Joined: Fri Apr 12, 2019 8:56 pm
- Location: Massachusetts
- Contact:
Re: Worst 3 year PP performance ever?
As have oftentimes been cited (with the benefit of hindsight).....Tyler wrote: ↑Wed Jun 10, 2015 12:56 pm
My dirty little secret is that since the start of this thread I figured out how to fully automate the process. As long as the returns data is available, this is easy.
If anyone has a special request, send me a PM. No promises on a fast response but I'll see what I can do. If I get enough requests, I may start a new thread to share results.[font=][font=] Eventually I'm looking into building a website to consolidate this kinda info and satisfy my data fetish,[/font][/font] so feel free to also PM me what data you find most interesting or would like to see visualized.
"And, the REST is history!!!!"
I LOVE reading history and it's been great reading in these old Topics all the incipients of your web site.
Vinny
Above provided by: Vinny, who always says: "I only regret that I have but one lap to give to my cats." AND "I'm a more-is-more person."
-
vnatale
- Executive Member
- Posts: 9472
- Joined: Fri Apr 12, 2019 8:56 pm
- Location: Massachusetts
- Contact:
Re: Worst 3 year PP performance ever?
What would be the best way to find this "new post"? I assume there is some way to do a search for Topics started on a certain day?MediumTex wrote: ↑Sat Jun 27, 2015 4:15 pmI started a new post for PP charts and put a sticky on it.iwealth wrote: Awesome, thanks PH. Can't believe you did so much of that manually. That chart should be a permanent fixture somewhere on this forum. Would hate to see it get buried someday.
Please repost your best work there.
Thanks!
Vinny
Above provided by: Vinny, who always says: "I only regret that I have but one lap to give to my cats." AND "I'm a more-is-more person."

Re: Worst 3 year PP performance ever?
He said he put a sticky on it, and it would be in the Permanent Portfolio Discussion section. Yep, there's "Cool Collection of PP Charts", the third on the list, started the same day.vnatale wrote: ↑Fri Jan 17, 2020 4:39 pmWhat would be the best way to find this "new post"? I assume there is some way to do a search for Topics started on a certain day?MediumTex wrote: ↑Sat Jun 27, 2015 4:15 pmI started a new post for PP charts and put a sticky on it.iwealth wrote: Awesome, thanks PH. Can't believe you did so much of that manually. That chart should be a permanent fixture somewhere on this forum. Would hate to see it get buried someday.
Please repost your best work there.
Thanks!
Vinny
-
vnatale
- Executive Member
- Posts: 9472
- Joined: Fri Apr 12, 2019 8:56 pm
- Location: Massachusetts
- Contact:
Re: Worst 3 year PP performance ever?
Tex did not directly say he'd put it in the "Permanent Portfolio Discussion section".Xan wrote: ↑Fri Jan 17, 2020 4:42 pmHe said he put a sticky on it, and it would be in the Permanent Portfolio Discussion section. Yep, there's "Cool Collection of PP Charts", the third on the list, started the same day.vnatale wrote: ↑Fri Jan 17, 2020 4:39 pmWhat would be the best way to find this "new post"? I assume there is some way to do a search for Topics started on a certain day?MediumTex wrote: ↑Sat Jun 27, 2015 4:15 pmI started a new post for PP charts and put a sticky on it.iwealth wrote: Awesome, thanks PH. Can't believe you did so much of that manually. That chart should be a permanent fixture somewhere on this forum. Would hate to see it get buried someday.
Please repost your best work there.
Thanks!
Vinny
I went here: index.php amd saw that there were eight sections and wondered which it would have been put in.
I now see that iwealth had said (above) "somewhere on this forum".
Rereading it that could be interpreted as either in the " "Permanent Portfolio Discussion section" or somewhere in the forum in one of eight sections. I had not thought to just look in the one forum where the post was made. One could say that should be obvious. It was not to me.
But once I read what you wrote it took me less than five seconds to see it. So thanks for that.
Vinny
Above provided by: Vinny, who always says: "I only regret that I have but one lap to give to my cats." AND "I'm a more-is-more person."