[img width=600]http://i.imgur.com/Oz9crTM.jpg[/img]
Here's a full chart of the real CAGRs of PPs started on the first of the month of every month since January 1972. These PPs are rebalanced annually, with dividends reinvested. Again, I took the PP data from PeakToTrough.com and CPI-U data from bls.gov/cpi/.
Some interesting features:
There have been several periods of longer than three years with negative real returns.
PPs started in June and July 1973 had negative real CAGRs after nine years! The worst was -1.1% real CAGR for the June start. These portfolios got off to bad starts and then rebalanced at terrible times in 1974, 1975, 1980, and 1981. Inflation was high, too, at 9.13% annualized.
If we ignore everything from pre-1975, then the worst starting dates were February 1980 (-0.1% real CAGR after five years), July-October 1980 (between -0.3 and -1.3% real CAGR after four years), and several months between July 1998 and May 1999 (the worst being December 1998: -0.3% real CAGR after four years).
The average real CAGR has been remarkably consistent at 4.7%. I take it to mean that if you are in the accumulation phase, adding money monthly and splitting the contributions evenly would have smoothed out the ride.
These returns are for PPs rebalanced every 12 months on the anniversary date. A PP using 35/15 bands would probably have done better. For example, starting on June 1 1973 and investing for nine years gave a nominal CAGR for a 35/15 PP (dividends reinvested) of 9.06%, with inflation of 9.13% annually, so a real CAGR of -0.07%. Still poor, but better than the -1.1% real CAGR for the annual-rebalance strategy.
You can see a higher-resolution version of the chart here.
Worst 3 year PP performance ever?
Moderator: Global Moderator
Re: Worst 3 year PP performance ever?
Last edited by Pet Hog on Mon Jun 22, 2015 8:56 pm, edited 1 time in total.
Re: Worst 3 year PP performance ever?
This was all in the past. What if the future calls for higher interest rates and lower gold prices? What then?

Re: Worst 3 year PP performance ever?
Nice job, Pet Hog. That's a -lot- of data!
Just as a trivia note, this makes me appreciate doing my rebalancing in December. Seems to be less red around then.
There are no guarantees in investing -- returns may be lower and may be higher. I still have yet to find a portfolio I think is better for me. Having made the best decision I feel I can with the available data, my view is that one who does not over-extend themselves on debt and spending is in the best position to handle any outcome at either extreme. Control what you can so you don't have to lose sleep over what you cannot.
Just as a trivia note, this makes me appreciate doing my rebalancing in December.
There are no guarantees in investing -- returns may be lower and may be higher. I still have yet to find a portfolio I think is better for me. Having made the best decision I feel I can with the available data, my view is that one who does not over-extend themselves on debt and spending is in the best position to handle any outcome at either extreme. Control what you can so you don't have to lose sleep over what you cannot.
-
MachineGhost

- Executive Member

- Posts: 10054
- Joined: Sat Nov 12, 2011 9:31 am
Re: Worst 3 year PP performance ever?
Nine years?!! Woah, fuil stop!!!
We now need to know which month is the absolute best to start and annually rebalance a PP.
We now need to know which month is the absolute best to start and annually rebalance a PP.
"All generous minds have a horror of what are commonly called 'Facts'. They are the brute beasts of the intellectual domain." -- Thomas Hobbes
Disclaimer: I am not a broker, dealer, investment advisor, physician, theologian or prophet. I should not be considered as legally permitted to render such advice!
Disclaimer: I am not a broker, dealer, investment advisor, physician, theologian or prophet. I should not be considered as legally permitted to render such advice!
-
MachineGhost
- Executive Member
- Posts: 10054
- Joined: Sat Nov 12, 2011 9:31 am
Re: Worst 3 year PP performance ever?
Actually, I meant that from the viewpoint of the shortest duration of negative real returns.Pet Hog wrote:MachineGhost wrote: Nine years?!! Woah, fuil stop!!!
We now need to know which month is the absolute best to start and annually rebalance a PP.
Jan 19724.712% 4.838%
4.739% 4.921%
4.719% 4.783%
4.645% 4.732%
4.401% 4.416%
4.306%
4.412%
4.363%
4.456%
4.472%
4.363%
4.583%
"All generous minds have a horror of what are commonly called 'Facts'. They are the brute beasts of the intellectual domain." -- Thomas Hobbes
Disclaimer: I am not a broker, dealer, investment advisor, physician, theologian or prophet. I should not be considered as legally permitted to render such advice!
Disclaimer: I am not a broker, dealer, investment advisor, physician, theologian or prophet. I should not be considered as legally permitted to render such advice!
Re: Worst 3 year PP performance ever?
That's easy -- always start your portfolio one month before a big gain!MachineGhost wrote: We now need to know which month is the absolute best to start and annually rebalance a PP.
I have no data to support it, but it wouldn't surprise me if large negative market events tend to take a break during the holidays along with investors.
In any case, don't forget that most people do not invest their life savings all at once and walk away. They save a little bit at a time. That changes the impact of that month #1 quite a bit. A short term loss may be quickly mitigated by buying more investments at a discount.
I always rebalance at the end of the year. Mostly because it's a lot easier to plan for taxes at the end of the year when income is known.
Re: Worst 3 year PP performance ever?
Code: Select all
1972  2014   2015
Jan  4.712%  4.838%
Feb  4.739%  4.921%
Mar  4.719%  4.783%
Apr  4.645%  4.732%
May  4.401%  4.416%
Jun  4.306%
Jul  4.412%
Aug  4.363%
Sep  4.456%
Oct  4.472%
Nov  4.363%
Dec 4.583% Re: Worst 3 year PP performance ever?
Taking the final values from the right-hand side of each line in the chart above gives the following chart of real CAGRs over the years for annual-rebalance-on-anniversary PPs:Pet Hog wrote: [img width=600]http://i.imgur.com/Oz9crTM.jpg[/img]
[img width=600]http://i.imgur.com/417ep7P.jpg[/img]
That's a pretty consistent portfolio.
(The numbers assume cashing out on the final anniversary; for example, the CAGRs for all the January portfolios are as of January 1, 2015, not today.)
-
Pointedstick

- Executive Member
- Posts: 8866
- Joined: Tue Apr 17, 2012 9:21 pm
- Contact:
Re: Worst 3 year PP performance ever?
Beautiful visualizations.
Human behavior is economic behavior. The particulars may vary, but competition for limited resources remains a constant.
- CEO Nwabudike Morgan
- CEO Nwabudike Morgan
Re: Worst 3 year PP performance ever?
Maybe my eyes are playing tricks on me but you can really see the January/February effect on that line chart. It's small but pretty consistent. Thanks for the charts/graphs.
Re: Worst 3 year PP performance ever?
Iwealth, I think it's an artifact arising from the way I calculated the returns. The January and February data include the returns up to Jan 1 and Feb 1 2015, respectively, whereas the June to December data only go up to those same months in 2014. The end of last year and January of this year were good months for the PP -- I'm guessing perhaps 8% real from July 1 to Feb 1? -- so the overall returns for each February will be that much higher than those for each July. That 8% compounded over 40+ years would be perhaps 0.2% annually. I think that's what we are seeing.iwealth wrote: Maybe my eyes are playing tricks on me but you can really see the January/February effect on that line chart. It's small but pretty consistent. Thanks for the charts/graphs.
You can see the effect in the small table I posted earlier today: The difference in CAGRs from February 1972 to February 2014 (42 years) and from February 1972 to February 2015 (43 years) is almost 0.2%:
Having said that, the value for February 2014 is higher than that for June 2014, so perhaps there is something to it after all!Pet Hog wrote:Code: Select all
1972  2014   2015
Jan  4.712%  4.838%
Feb  4.739%  4.921%
Mar  4.719%  4.783%
Apr  4.645%  4.732%
May  4.401%  4.416%
Jun  4.306%
Jul  4.412%
Aug  4.363%
Sep  4.456%
Oct  4.472%
Nov  4.363%
Dec  4.583%
Re: Worst 3 year PP performance ever?
Last post for a while, I promise.
[img width=600]http://i.imgur.com/qqOtJ6I.jpg[/img]
This chart is similar to the one I posted yesterday, but this one was calculated for a PP with biennial (every two years) rebalancing on the anniversary. So, starting January 1 1972 and then rebalancing on Jan 1 1974 and Jan 1 1976, etc., up to January 1, 2014, and then cashing out. So, again, the numbers don't go up to the present, except for the portfolios started on each May 1 of an odd year (e.g., May 1, 1987 was rebalanced every two years and cashed out on May 1, 2015). It's inconvenient, but easier to calculate with my limited Excel skills.
In theory, rebalancing biennially allows you to let your winners win and your losers lose; you don't catch a falling knife and whatever the opposite of that cliche is: you don't catch a rising firecracker in the crotch? So generally it has a slightly higher CAGR, but not by much (see the difference below, plotted in green). There's an obvious effect of the poor return from January 2012 to January 2014 (biennial, two years total, one rebalance) compared with the better return from January 2012 to January 2015 (annual, three years total, two rebalances), rippling all the way back to the 1980s. I should really take the time to plot each portfolio up to the current day.
Anyway, this is another version of the PP that has had amazingly consistent real growth of 40+ years.
[img width=600]http://i.imgur.com/R9mJtfR.jpg[/img]
-
buddtholomew

- Executive Member
- Posts: 2464
- Joined: Fri May 21, 2010 4:16 pm
Re: Worst 3 year PP performance ever?
Thank you for this timely post and don't apologize for producing such meaningful content. I have been debating whether to contribute additional cash to the lagging assets but may postpone purchases until a lower band is breached. I always buy prematurely, but it appears patience and the PP go hand in hand.Pet Hog wrote: Last post for a while, I promise.
[img width=600]http://i.imgur.com/qqOtJ6I.jpg[/img]
This chart is similar to the one I posted yesterday, but this one was calculated for a PP with biennial (every two years) rebalancing on the anniversary. So, starting January 1 1972 and then rebalancing on Jan 1 1974 and Jan 1 1976, etc., up to January 1, 2014, and then cashing out. So, again, the numbers don't go up to the present, except for the portfolios started on each May 1 of an odd year (e.g., May 1, 1987 was rebalanced every two years and cashed out on May 1, 2015). It's inconvenient, but easier to calculate with my limited Excel skills.
In theory, rebalancing biennially allows you to let your winners win and your losers lose; you don't catch a falling knife and whatever the opposite of that cliche is: you don't catch a rising firecracker in the crotch? So generally it has a slightly higher CAGR, but not by much (see the difference below, plotted in green). There's an obvious effect of the poor return from January 2012 to January 2014 (biennial, two years total, one rebalance) compared with the better return from January 2012 to January 2015 (annual, three years total, two rebalances), rippling all the way back to the 1980s. I should really take the time to plot each portfolio up to the current day.
Anyway, this is another version of the PP that has had amazingly consistent real growth of 40+ years.
[img width=600]http://i.imgur.com/R9mJtfR.jpg[/img]
"The first principle is that you must not fool yourself and you are the easiest person to fool" --Feynman.
Re: Worst 3 year PP performance ever?
Love that last line chart, Pet Hog. Here's another way to look at it. (Basically graphing the bottom bar on your main chart, but using my annual data)
[img width=500]http://i62.tinypic.com/307noxx.jpg[/img]
[img width=500]http://i61.tinypic.com/2h72f0k.jpg[/img]
Note the median hill in the middle of the 60/40 chart. 20-year runs get fat on the 80's and 90's but come back to earth the longer you look. The PP is really consistent in comparison.
As a general note to anyone reading these, please keep in mind that while holding an investment over a long time decreases uncertainty of the average return, the uncertainty in any given year remains the same. Even in year 30, performance next year could be anywhere in (or out of!) the range at the left side of the chart.
(And apologies for posting these yesterday but deleting them. I wanted to take some time to improve the charts to avoid confusion.)
Re: Worst 3 year PP performance ever?
Kudos and many thanks for the terrific charts!... They really give a uniquely different (and comforting) perspective!
Re: Worst 3 year PP performance ever?
Pet Hog/Tyler, thanks again to both of you for all of the amazing visualizations.
Pet Hog, not sure if you'd be willing to make a modification, but it strikes me there's a little room for more granularity in the color coding. Since the 3-6% average return range makes up such a vast majority of the data, it would be interesting to see that broken down perhaps into two subsets like 3-4.5% and 4.5%-6% or even a 3-4, 4-5, 5-6%. After 30 years, it looks like the max return was 5.8% vs. a minimum of 3.6%. That's a pretty tight range, but it's still fairly large when one starts to consider safe withdrawal rates and such.
Anyways, just a thought..
Re: Worst 3 year PP performance ever?
Tyler, your charts really show how big a difference start date makes in portfolio performance. Using annual start dates it only takes 3 years before all portfolios show a real return, while PH's monthly start dates take 10 years. That's a pretty big variance. Daily start dates would probably carry it out even farther.Tyler wrote: Love that last line chart, Pet Hog. Here's another way to look at it. (Basically graphing the bottom bar on your main chart, but using my annual data)
Re: Worst 3 year PP performance ever?
One should not necessarily assume that all of the variation is due to start date. The more granular the analysis, the more likely you are to find all kinds of outliers. For example, something like the flash crash ten years in could create a snapshot of a long-term loss for one month that doesn't tell the whole story.iwealth wrote: Tyler, your charts really show how big a difference start date makes in portfolio performance. Using annual start dates it only takes 3 years before all portfolios show a real return, while PH's monthly start dates take 10 years. That's a pretty big variance. Daily start dates would probably carry it out even farther.
Next, remember that everything is relative. I expect that a similar chart for stocks would show negate periods more than 20 years out.
Finally, remember that there's rarely a single start date. Most people don't invest their life savings on day one -- they invest lots of smaller periodic contributions. That would change the analysis considerably.
Basically, always be careful about reading too much into any one chart. Real life usually isn't so organized.
Last edited by Tyler on Fri Jun 26, 2015 8:30 pm, edited 1 time in total.


Re: Worst 3 year PP performance ever?
I don't recall exactly what we said in the book, but I have always thought that for most new PPers it made sense to ease into the strategy slowly, not necessarily with the goal of timing the markets, but just to gradually acclimate yourself to the strategy and to make sure they you don't have the bad luck of starting your portfolio at the worst possible time.
The thing is, the worst possible time usually looks like a great time because it often comes after the portfolio has experienced above average returns and everyone is talking about it.
The best time to start a new PP is probably when everyone hates the strategy and thinks that it has finally stopped working, but no one wants to do it then.
I will never forget how in the first half of 2008 EVERYONE was saying that the worst possible investment was 30 year treasuries, and that the secular bull market in treasuries was over because gold was clearly indicating that higher inflation and higher interest rates were on the horizon. There simply wasn't a more obvious play than to either stay away from long dated treasuries, or if you were REALLY smart you could just short them and make some easy money. That didn't work out very well:
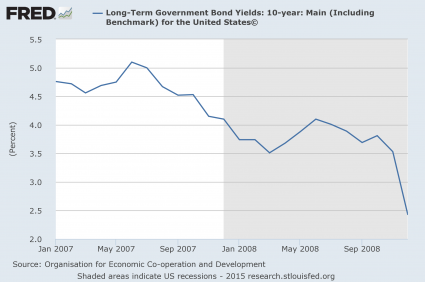
At that time I was still trying to completely wrap my mind around the PP concept, and everyone I talked to about it said that ANY strategy that called for 25% of the portfolio to be held in 30 year treasuries was a dumb strategy and that's why they would never seriously consider using it. Those conversations really opened my eyes to how little anyone really knows about what the markets are going to do next.
In retrospect, mid-2008 would have been a GREAT time to start a new PP because the PP maintained its value when everything else was getting wiped out in the second half of the year, and then it saw returns above the historical mean in 2009, 2010, and 2011.
The thing is, the worst possible time usually looks like a great time because it often comes after the portfolio has experienced above average returns and everyone is talking about it.
The best time to start a new PP is probably when everyone hates the strategy and thinks that it has finally stopped working, but no one wants to do it then.
I will never forget how in the first half of 2008 EVERYONE was saying that the worst possible investment was 30 year treasuries, and that the secular bull market in treasuries was over because gold was clearly indicating that higher inflation and higher interest rates were on the horizon. There simply wasn't a more obvious play than to either stay away from long dated treasuries, or if you were REALLY smart you could just short them and make some easy money. That didn't work out very well:
At that time I was still trying to completely wrap my mind around the PP concept, and everyone I talked to about it said that ANY strategy that called for 25% of the portfolio to be held in 30 year treasuries was a dumb strategy and that's why they would never seriously consider using it. Those conversations really opened my eyes to how little anyone really knows about what the markets are going to do next.
In retrospect, mid-2008 would have been a GREAT time to start a new PP because the PP maintained its value when everything else was getting wiped out in the second half of the year, and then it saw returns above the historical mean in 2009, 2010, and 2011.
Q: “Do you have funny shaped balloons?”
A: “Not unless round is funny.”
A: “Not unless round is funny.”
Re: Worst 3 year PP performance ever?
This is true. So not just start dates, but also end dates.Tyler wrote: One should not necessarily assume that all of the variation is due to start date. The more granular the analysis, the more likely you are to find all kinds of outliers. For example, something like the flash crash ten years in could create a snapshot of a long-term loss for one month that doesn't tell the whole story.
Next, remember that everything is relative. I expect that a similar chart for stocks would show negate periods more than 20 years out.
No doubt. I hope my post didn't come off as a negative jab against the PP. I was just intrigued by the data. Start date portfolio performance variation has always been an interest of mine. I think it gets overlooked. Statistically dollar-cost averaging underperforms lump sum investing and I've always believed that to be the way to go. But I'm starting to change my tune a bit. You don't want to end up being that negative outlier.
Re: Worst 3 year PP performance ever?
And don't underestimate people's psychological need to gradually ease into something as unusual as the PP.iwealth wrote: No doubt. I hope my post didn't come off as a negative jab against the PP. I was just intrigued by the data. Start date portfolio performance variation has always been an interest of mine. I think it gets overlooked. Statistically dollar-cost averaging underperforms lump sum investing and I've always believed that to be the way to go. But I'm starting to change my tune a bit. You don't want to end up being that negative outlier.
In reading rookie posts here, a common theme is: "I invested everything I've got in the PP six months ago and it's down 3%! This isn't what I signed up for. I'm going to look for something safer."
I think that if you ease into it and it goes down you can feel good about dollar cost averaging as you build your position, and if it goes up you can congratulate yourself on choosing a good strategy as you build your position. I think that this approach is consistent with the way a lot of people actually think.
I would rather see a new PP investor leave a few percentage points of gain on the table when he started out if it meant that he was able to stick with the strategy over the longer term because he didn't experience early trauma with it.
Q: “Do you have funny shaped balloons?”
A: “Not unless round is funny.”
A: “Not unless round is funny.”
Re: Worst 3 year PP performance ever?
Here you go, iwealth! Good suggestion. I added black and blue colors to the chart for the highest real CAGRs, and used the three shades of green for what used to be the 3-6% band. A lot more detail has emerged.iwealth wrote: Pet Hog, not sure if you'd be willing to make a modification, but it strikes me there's a little room for more granularity in the color coding. Since the 3-6% average return range makes up such a vast majority of the data, it would be interesting to see that broken down perhaps into two subsets like 3-4.5% and 4.5%-6% or even a 3-4, 4-5, 5-6%. After 30 years, it looks like the max return was 5.8% vs. a minimum of 3.6%. That's a pretty tight range, but it's still fairly large when one starts to consider safe withdrawal rates and such.
[img width=600]http://i.imgur.com/HjSCtIf.jpg[/img]
As an aside, I chose the colors originally to copy Tyler's charts. He had mentioned somewhere that Excel allows "conditional formatting," which was news to me, and it wasn't too difficult to use it to color most of the cells in my old chart. Unfortunately, my version of Excel allows only three conditional formats (I used them here for the three green cells), so adding these new colors in was quite tedious. I hope I haven't made any mistakes. There were a lot of cells to check!
Re: Worst 3 year PP performance ever?
That chart is amazing.
Wow.
Wow.
Q: “Do you have funny shaped balloons?”
A: “Not unless round is funny.”
A: “Not unless round is funny.”
-
mathjak107

- Executive Member
- Posts: 4456
- Joined: Fri Jun 19, 2015 2:54 am
- Location: bayside queens ny
- Contact:
Re: Worst 3 year PP performance ever?
it is always the fact the best of outlooks end up having either the worst performance or all the biggest drops come from those times things couldn't look better.MediumTex wrote: I don't recall exactly what we said in the book, but I have always thought that for most new PPers it made sense to ease into the strategy slowly, not necessarily with the goal of timing the markets, but just to gradually acclimate yourself to the strategy and to make sure they you don't have the bad luck of starting your portfolio at the worst possible time.
The thing is, the worst possible time usually looks like a great time because it often comes after the portfolio has experienced above average returns and everyone is talking about it.
The best time to start a new PP is probably when everyone hates the strategy and thinks that it has finally stopped working, but no one wants to do it then.
I will never forget how in the first half of 2008 EVERYONE was saying that the worst possible investment was 30 year treasuries, and that the secular bull market in treasuries was over because gold was clearly indicating that higher inflation and higher interest rates were on the horizon. There simply wasn't a more obvious play than to either stay away from long dated treasuries, or if you were REALLY smart you could just short them and make some easy money. That didn't work out very well:
At that time I was still trying to completely wrap my mind around the PP concept, and everyone I talked to about it said that ANY strategy that called for 25% of the portfolio to be held in 30 year treasuries was a dumb strategy and that's why they would never seriously consider using it. Those conversations really opened my eyes to how little anyone really knows about what the markets are going to do next.
In retrospect, mid-2008 would have been a GREAT time to start a new PP because the PP maintained its value when everything else was getting wiped out in the second half of the year, and then it saw returns above the historical mean in 2009, 2010, and 2011.
all the best market times come from the worst outlooks . they come from the depths of stock market hell when the word equities makes you want to vomit.
Re: Worst 3 year PP performance ever?
Awesome, thanks PH. Can't believe you did so much of that manually. That chart should be a permanent fixture somewhere on this forum. Would hate to see it get buried someday.
Last edited by iwealth on Sat Jun 27, 2015 8:30 am, edited 1 time in total.