johnnywitt wrote: ↑Fri Sep 09, 2022 6:44 pm
jason wrote: ↑Tue Sep 06, 2022 2:12 pm
I was just wondering if the performance of the PP year-to-date is the worst it has ever performed, or has it had a period(s) in the past where it actually performed worse? I've been doing the PP for 9 years and my returns are anemic. My CAGR is around 5%. Because I am retired and living off of my investments, I'm looking at the possibility of having to move into riskier investments or else having to slash my lifestyle/living expenses, which my wife probably will not want to tolerate. She'd rather take more risk than do that. Are many people here still optimistic about it bouncing back?
Harry Browne's LONG TERM INVESTING STRATEGY.
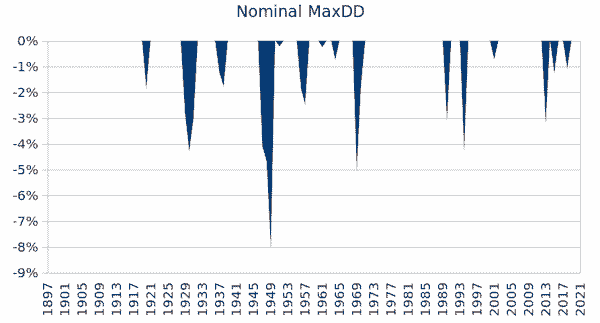
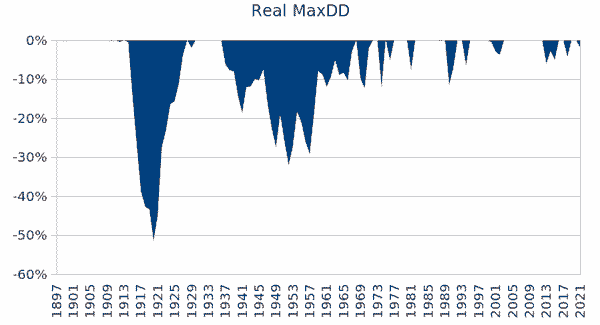
British (UK) Permanent Portfolio data since start of 1896 to end of 2021, calendar yearly granularity. Hard PP (cash in T-Bills, UK stock index, gold, 20 year treasury), with the exception of pre 1932 where it was assumed T-Bills were held instead of gold - when gold/money were convertible at a fixed rate it made more sense to hold T-Bills for their interest - as that was like the state paying you for it to securely store your gold. That convertibility ended in 1931 (US followed that lead in 1933), after gold reserves were running low due to mass conversion of money into gold. Unlike the US, UK investors could still trade gold since then.
Looking at 'risk' from a perspective of return OF money : 3% SWR i.e. 3% of the start date portfolio value drawn at the start, and where a inflation adjusted identical amount is drawn at the start of subsequent years, and for 30 year timeframes (so 90% of your inflation adjusted capital returned in instalments over 30 years), and at the end of those 30 years there was just one case (1937 start of WW1) where there was nothing left - you only got back 90% of your (inflation adjusted) money.
In other cases, in inflation adjusted terms, at the end of 30 years (these figures include that 1937 start year) ...
3% SWR. 100% success rate
6% chance < 10% of the inflation adjusted start date portfolio value left at the end of 30 years
60% chance of more than 50% left
42% chance of having the same or more
7% chance > 200% left
Median case 81% left (average 89%)
So a relatively low 6% chance of not getting all your money back, but nearly all of it.
In the median (indicator of the most common) case after 30 years of 3% (so 90% of your money back) you ended with a portfolio value of 81% of the inflation adjusted start date portfolio value.
Pretty good odds (low LONGER TERM risk)
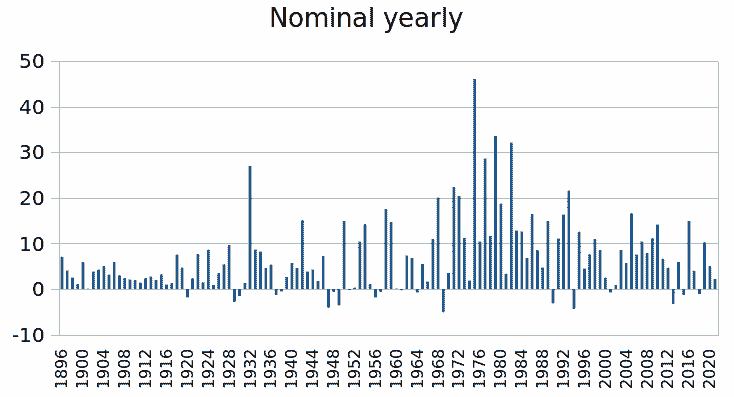
And a reasonably comfortable ride along the way. Few years ended in negative nominal and when they did occur they were relatively mild down-years
But within that, finer granularity than yearly, and there were times of deeper down's, which are only troubling if you watch the portfolio value every minute/hour/day/week/month.
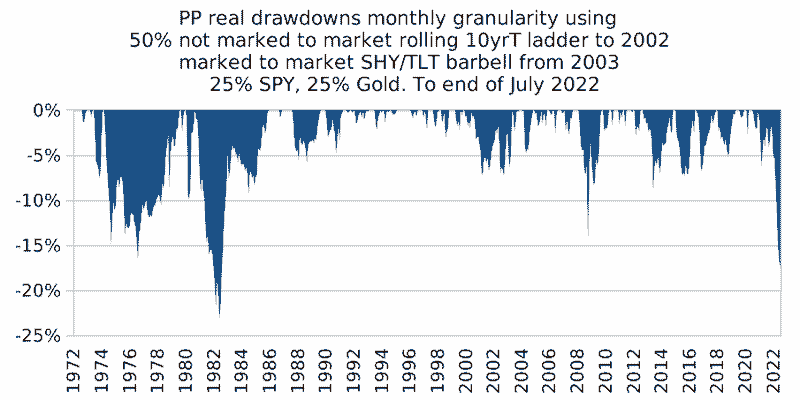
The UK over those years was a more mid-stream/average case, pretty much reflective of 'global'. Excepting the earlier part (WW1) when it transitioned from being the primary reserve currency, handing that over to the US. The US was more of a right-tail good/great case outcome, such that its PP would reflect above average outcomes. There would be other cases with bad case outcomes, Germany, Russia ...etc. As ever, there are no guarantees. No guaranteed 'better' alternatives. If for instance you applied the same 3% SWR to T-Bills then for a 1935 start date year you'd have had no money remaining after 21 years, you got back just 63% of your money. If you started in 1973 with all stock and seen 9.2% inflation -28% stock total return decline that year, followed by 16% inflation in 1974 when stocks declined -50%, I suspect you'd be kicking yourself for having gone for 'ending with a higher amount remaining at the end' objective/target, and like as many did in those years capitulated to 'save what little remained'.
Fundamentally a PP is a reasonably safe choice for "money you can't afford to lose" (over the longer (30 year) term) as Harry put it, but where that's not 100% true in all-cases, more of a guideline than a rule. Where any surplus capital above and beyond that might be invested in more speculative ventures (Variable Portfolio). Should you adjust the PP because 20 year treasury yields are low/negative-real, or when stock PE's are at extreme highs, or the Dow/Gold ratio is down at 1.0 type levels? Generally no, as that otherwise then becomes a Variable Portfolio, you're timing the market - which may add to rewards, might detract from rewards. Overall you'll deviate either side of the PP's line in a random manner. Even when PE's are extreme highs they could go higher, even at low Dow/Gold ratio they could go lower, even at low 20 year treasury yields they could go lower. The market generally levels prices to reflect 50/50 odds of either gains/losses, or soon revises prices towards those odds as/when such 'better odds' appear.
The biggest risk with the PP as I see it is that of regret at the end of 30 years when you might look back and see how much more you might have had at that time if only you'd gone with 100% stock. But that involves having taken on more risk that you might have endured the 1974/75 type example case outcome above. And for many the size of the final pot value may not even be a issue, especially for those that don't live another 30 years. Large wealth left as a legacy is often just wasted away such that having taken on additional personal risk resulted in little overall actual reward/benefit to you, or others.